Trying to run a call centre without tracking the right numbers is like sailing a ship without a compass. You might be moving, but you have no idea if you're headed for treasure or a storm. That's where call centre key performance indicators (KPIs) come in. They aren’t just data points on a spreadsheet; they are the vital signs of your entire operation, guiding you toward happier customers and a more effective team.
What Are Call Centre KPIs and Why Do They Matter?
So, what are these KPIs? Think of them as quantifiable signposts that measure how well your contact centre is doing. They turn the chaos of daily calls, emails, and chats into clear, understandable numbers. This clarity shows you exactly what's working beautifully and where you've got opportunities to improve. Without them, you're just guessing.
A simple metric tells you one thing, like an agent's number of answered calls. But a true KPI connects that activity to a bigger business goal. It’s the difference between knowing your car's speed and having a full dashboard showing speed, fuel, engine health, and your ETA. It helps you shift from putting out fires to strategically planning your journey. For a more detailed look at the most important ones, check out our comprehensive guide on essential call centre KPIs.
To make this even clearer, let's break down the most common KPIs in a quick-reference table.
Core Call Centre KPIs at a Glance
This table gives you a snapshot of the metrics that form the backbone of any high-performing call centre.
| KPI (Key Performance Indicator) | What It Measures | Why It Matters to Your Business |
|---|---|---|
| First Call Resolution (FCR) | Percentage of issues solved on the first contact. | High FCR means happier customers and lower operational costs. |
| Average Handle Time (AHT) | The average duration of a single customer interaction. | Helps you gauge agent efficiency and plan staffing needs accurately. |
| Customer Satisfaction (CSAT) | How happy customers are with their interaction. | A direct line to customer loyalty and brand reputation. |
| Agent Occupancy/Utilisation | How much of an agent's paid time is spent on work-related tasks. | Ensures you're not overstaffed or burning out your team. |
| Service Level | The percentage of calls answered within a specific time frame. | A key indicator of your centre's accessibility and responsiveness. |
Understanding these metrics is the first step, but the real power comes from using them to drive meaningful change across your organisation.
The Strategic Value of Tracking KPIs
Keeping a close eye on the right indicators is about more than just hitting targets; it's about creating a roadmap for smart, strategic decisions. When you consistently monitor your KPIs, you unlock some serious benefits:
- Boost Customer Loyalty: When you focus on metrics like Customer Satisfaction (CSAT) and First Call Resolution (FCR), you're directly improving the quality of the customer's experience, which is what keeps them coming back.
- Improve Operational Efficiency: Indicators such as Average Handle Time (AHT) and Agent Utilisation shine a light on bottlenecks and inefficiencies, helping you get the most out of your resources.
- Enhance Team Performance: KPIs offer a fair and objective way to provide feedback. They make it easy to spot who needs a bit of coaching and who deserves a shout-out, creating a culture where everyone is aiming higher.
A well-chosen set of KPIs acts as a shared language across your organisation, aligning agents, managers, and executives around a unified vision of success. It transforms subjective opinions into objective, data-driven conversations about what truly matters.
This focus on operational excellence isn't just a local game; it has a global impact. For instance, Poland has emerged as a major hub for call centre outsourcing in Europe. This is thanks to its large, multilingual talent pool and significant cost advantages. The Polish business process outsourcing sector now employs over 350,000 professionals. It manages to deliver high-quality service while keeping labour costs 30-40% lower than in Western Europe. This just goes to show how mastering your KPIs can build a formidable competitive advantage on the world stage.
Organising Your KPIs for True Insight
Staring at a dashboard packed with dozens of numbers is a fast track to confusion, not clarity. To find the real story hidden in your data, you have to be smart about how you organise your call centre's key performance indicators. Without a clear structure, you're just looking at data. With one, you start seeing the powerful narratives that drive your entire operation.
Think of it like a mechanic running diagnostics on a car. They don't just get a single, vague "engine health" score. They get specific readouts for the ignition, the fuel system, and the emissions. This targeted approach lets them pinpoint the exact source of a problem instead of just making an educated guess.
We're going to apply that same diagnostic logic to your call centre, grouping KPIs into focused buckets. This method helps you see how different parts of your operation affect one another, allowing you to get right to the root cause of any issue.
Customer Happiness Metrics
This first group is all about one thing: the quality of the customer's experience. These aren't just fluffy, feel-good numbers; they are powerful leading indicators of customer loyalty, brand reputation, and, ultimately, future revenue. If you see a dip here, it's an early warning sign that something in your process is broken.
Key KPIs in this group include:
- Customer Satisfaction (CSAT): The classic "How did we do?" metric. It gives you a direct pulse on the quality of a single interaction.
- Net Promoter Score (NPS): This one looks at the bigger picture, measuring long-term loyalty by asking how likely a customer is to recommend your company to others.
- Customer Effort Score (CES): This gauges how easy it was for a customer to get their issue resolved. It's a surprisingly strong predictor of whether they'll stick with you.
- First Call Resolution (FCR): Many consider this the holy grail of happiness metrics. Why? Because everyone wants their problem solved on the first try. High FCR naturally boosts every other satisfaction score.
A falling CSAT score, for instance, might not be an agent problem at all. It could be a sign that your FCR is struggling. By grouping these metrics, you can spot that connection instantly.
This infographic shows how a core metric like Average Handle Time (AHT) is a central element of efficiency.
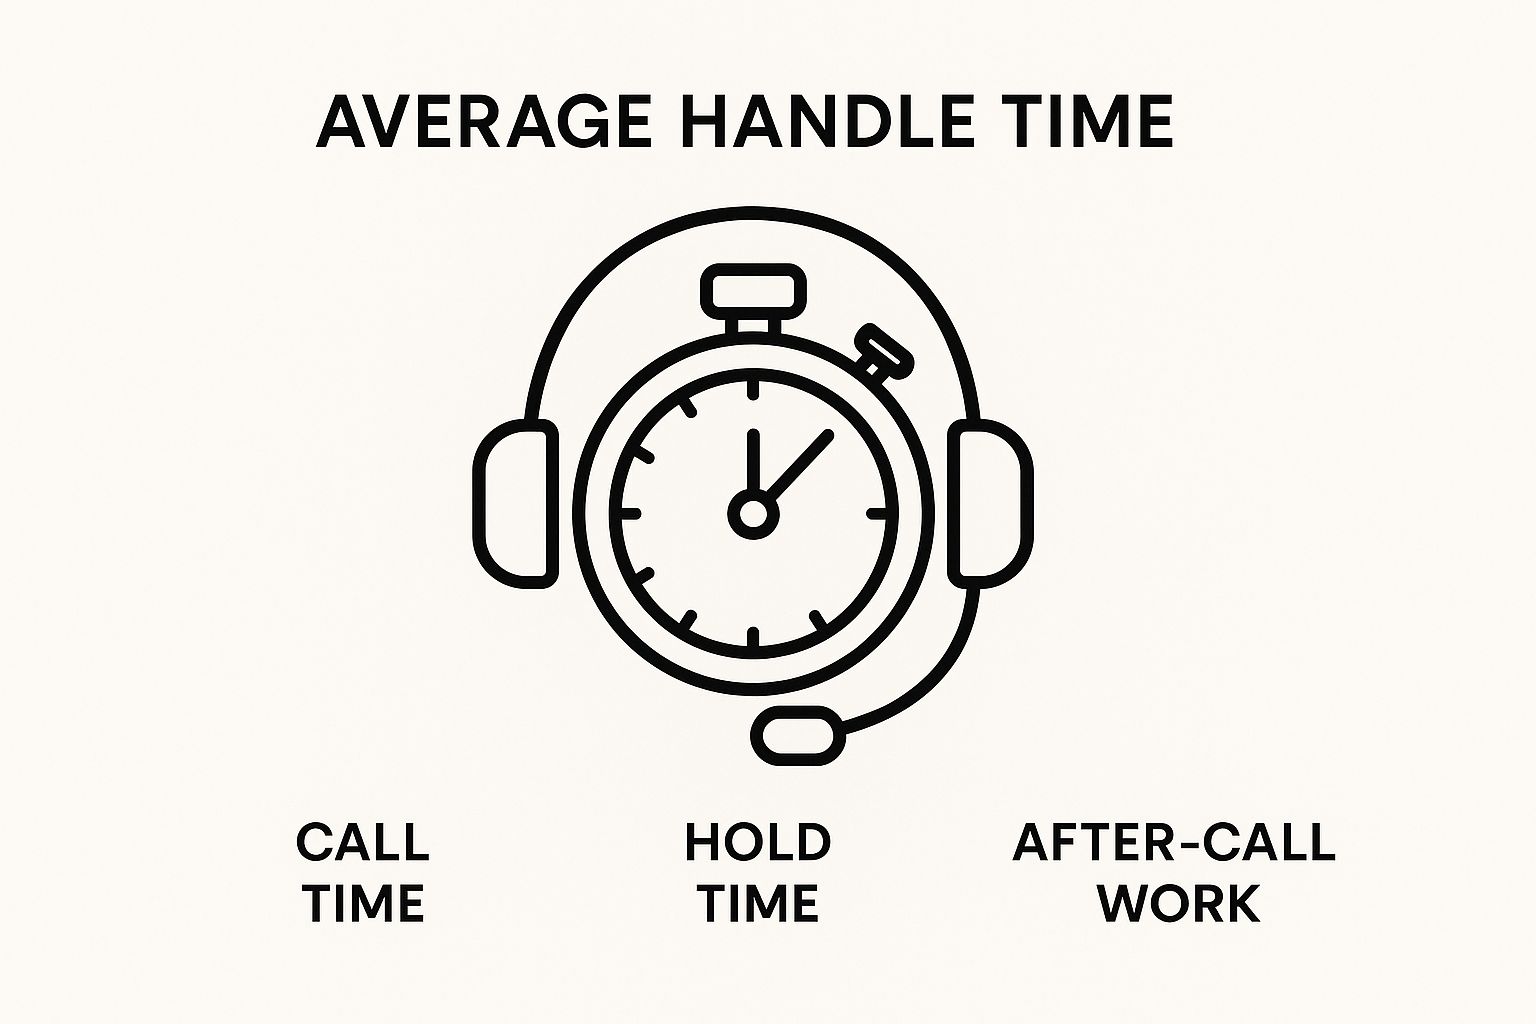
It’s a powerful symbol for how every second counts in a call centre, blending the human element (the headset) with the constant pressure of time (the stopwatch).
Team Productivity and Performance
This next bucket of call centre key performance indicators zeroes in on how efficiently your team is working. These metrics are absolutely crucial for planning your resources, coaching your agents, and spotting where you can improve your processes. They help you ensure your team is working smart, without ever sacrificing the quality of your service.
While efficiency is the goal, these metrics should be used to support agents, not just scrutinise them. A sudden spike in an agent's handle time could signal a new, complex issue that the whole team needs training on.
Core productivity metrics to watch:
- Average Handle Time (AHT): This is the total time an agent spends on an interaction from start to finish. It includes talk time, hold time, and any follow-up work.
- Agent Utilisation: This measures the percentage of an agent's logged-in time that is spent on active, call-related activities.
- After Call Work (ACW): The time an agent needs for follow-up tasks—like updating notes or sending an email—after an interaction has officially ended.
Operational Health and Efficiency
Finally, this category gives you that high-level, "30,000-foot" view of your entire call centre's health. Think of these as the bedrock of your strategic planning. They help you perfectly balance your budget, staffing levels, and service quality goals.
Key operational KPIs include:
- Service Level: The percentage of calls answered within a set time. A common industry standard is 80% of calls answered in 20 seconds.
- Abandonment Rate: This is the percentage of callers who hang up before they even get to speak with an agent. It's a direct measure of your customers' patience.
- Average Speed of Answer (ASA): This tracks the average time it takes for a call to be picked up by an agent once it hits the queue.
When you organise your KPIs this way, a flat list of numbers transforms into a dynamic diagnostic tool. You stop guessing and start seeing the real story of your call centre's performance.
Decoding the Voice of Your Customer with KPIs

Behind every single call, email, or chat that comes into your centre, there's a human story. Your customers are constantly telling you what they think and how they feel, but it's all too easy for their individual voices to get lost in the day-to-day operational whirlwind. This is where a few specific call centre key performance indicators come into play. They act as your translator, turning raw customer emotion into concrete data you can actually use.
These metrics aren't just abstract numbers on a dashboard; they are direct measures of human feeling. So let's forget the textbook definitions and look at how they capture what a customer really goes through.
The Tale of Two Customers
Picture two customers, Anna and Bartosz. Both of them need to get in touch about a recent order.
Anna calls your support line. The agent she speaks with grasps her problem immediately and sorts it out in less than five minutes. She hangs up the phone feeling heard, relieved, and honestly, pretty good about your company. A follow-up survey lands in her inbox asking how satisfied she was, and she doesn’t hesitate to give a top score.
Bartosz, on the other hand, has a completely different journey. He’s stuck on hold for what feels like an eternity, gets transferred twice, and has to repeat his story from the beginning to each new agent. He eventually gets his issue resolved, but the whole ordeal leaves a sour taste. When he gets the same survey, his score tells you exactly how frustrated he is.
Anna’s and Bartosz’s experiences, though worlds apart, are both perfectly captured by the same set of vital KPIs.
Measuring Customer Happiness and Loyalty
To really understand the difference between Anna's delight and Bartosz's frustration, you need to look at the metrics that quantify those feelings. These KPIs are the true pulse of any customer-focused operation.
- Customer Satisfaction (CSAT): Think of this as the "in-the-moment" snapshot. It asks a simple, direct question like, "How satisfied were you with your interaction today?" Anna’s high score is a clear signal that the process worked exactly as it should have. Bartosz’s low score is an immediate red flag that something went wrong.
- Net Promoter Score (NPS): This one looks at the bigger picture: long-term loyalty. It asks, "How likely are you to recommend us to a friend or colleague?" Anna, after her seamless experience, becomes a Promoter – she's your advocate. Bartosz, feeling like his time was wasted, becomes a Detractor. NPS gives you the balance between your biggest fans and your harshest critics.
- Customer Effort Score (CES): This KPI gets to the heart of the customer's journey by asking, "How easy was it for you to handle your request?" For Anna, the effort was minimal. For Bartosz, it was incredibly high. A low effort score is a powerful indicator of loyalty; in fact, some research suggests it's even better than CSAT at predicting a customer's future spending.
When you track these three metrics together, you get a complete emotional picture. CSAT tells you about the moment, CES reveals the effort involved, and NPS helps predict the future of the relationship.
First Call Resolution: The Ultimate Service Goal
If there's one metric that often stands out from the pack, it’s First Call Resolution (FCR). This KPI simply measures the percentage of customer issues you solve on the very first contact, with no need for a transfer or a follow-up call. Anna’s interaction was a 100% FCR success. Bartosz's was 0%, because his single problem turned into a multi-contact headache.
FCR is often called the "holy grail" of service metrics for a good reason—it has a direct, positive impact on everything else. When your FCR is high, your CSAT, NPS, and CES scores naturally follow suit. Customers are happier, your operational costs drop because you're handling fewer repeat calls, and your agents feel more empowered and successful in their roles.
This intense focus on service quality is a cornerstone of the modern business services sector. In Poland, for instance, the industry has become a huge economic driver, with over 2,000 business service centres contributing an estimated 5.7% to the country's GDP. These centres employ nearly half a million people, and their success is built on delivering high-value, efficient customer interactions—a goal measured directly by KPIs like FCR. You can dive deeper into this sector's impressive growth in the full ABSL report.
Boosting Performance with Agent Productivity KPIs
Let's get one thing straight: building a truly effective team is about support and empowerment, not just scrutiny. While some managers fall into the trap of using productivity metrics to police their agents, the best leaders know these are powerful tools for coaching and development.
When you look at them the right way, these call centre key performance indicators are less like a stern report card and more like a coach's game-day footage.

This data shows you exactly where your team is knocking it out of the park and where they might need a bit more practice to perfect their plays. It’s all about building a motivated, highly skilled team that scores wins for your customers every single day. This is just one piece of the puzzle, and you can see how it fits into the grand scheme by exploring effective call centers workforce management.
Average Handle Time (AHT)
Average Handle Time (AHT) is probably the most famous—and most misunderstood—productivity KPI out there. It measures the entire lifecycle of a customer interaction, starting the second an agent answers and ending only when all the related post-call work is done. This includes talk time, hold time, and any wrap-up tasks.
A classic mistake is to fixate on driving AHT as low as possible. Sure, a lower AHT can suggest efficiency, but if agents are rushing, it often leads to unresolved problems and seriously annoyed customers. The real aim is to find that sweet spot—an optimal AHT where agents are both efficient and thorough, which in turn boosts your First Call Resolution.
Think about it: a sudden AHT spike for one agent doesn't automatically mean they're slacking. It could be a heads-up that they're tackling a complex new issue that the rest of your team is about to encounter. That's not a problem; it's a perfect coaching moment.
You should see AHT as a diagnostic tool, not a weapon. An agent with a consistently high AHT might need better software or more training. On the flip side, an agent with a suspiciously low AHT could be cutting corners and tanking customer satisfaction in the process.
Agent Utilisation
Agent Utilisation is a simple but powerful metric. It tells you the percentage of an agent's paid time that is actually spent on work-related activities. This isn't just about talk time; it includes all the time they are available and ready to take calls, too. It gives you a crystal-clear picture of how well your staffing levels match your real-time workload.
Imagine a football team with key players stuck on the bench during a make-or-break play—that's underutilisation. In the same way, if your agents are sitting around waiting for the phone to ring, your utilisation is low, and you're probably paying for more staff than you need.
But be careful. A utilisation rate that’s constantly pushing 100% is a massive red flag for agent burnout. It means your people have zero time to catch their breath between calls, which is a fast track to exhaustion and a nosedive in service quality.
After Call Work (ACW)
After Call Work (ACW), which you might know as "wrap-up time," tracks how long agents spend on tasks after a call has finished. This is crucial admin time, and it typically includes:
- Updating the customer’s profile in the CRM
- Sending out follow-up emails or resources
- Leaving detailed notes for the next agent who might handle the case
Just like AHT, the goal here isn't to slash ACW to zero, but to optimise it. A high ACW is often a symptom of clunky software or inefficient processes. If your team has to click through five different screens just to log a single call, their ACW is going to be high, and it's not their fault.
By streamlining these workflows or integrating your systems better, you can cut down ACW while actually improving the quality of your data and getting your agents ready for the next customer faster.
Achieving Peak Operational Efficiency
If customer-facing KPIs tell you how well a single conversation went, operational KPIs give you the 30,000-foot view of your entire call centre's health.
Picture your operation as an air traffic control tower at a bustling airport. Your job is to land every plane (call) safely and efficiently. You can't afford to keep them circling in a costly and frustrating holding pattern. These operational metrics are your radar, giving you the data you need to manage that complex traffic. They help you make smart calls on staffing, resource allocation, and process tweaks. Getting this right is how you balance excellent service with a sensible budget.
The Balancing Act of Service Level
A cornerstone metric here is your Service Level. Put simply, it’s the percentage of calls you answer within a specific timeframe. You'll often hear the classic 80/20 target, which means the goal is to answer 80% of incoming calls within 20 seconds.
This single number perfectly captures the tightrope walk between staffing and service quality. Aiming for a 95/10 Service Level might look great on a report, but it would mean overstaffing your centre, driving up costs and leaving agents with too much idle time. On the other hand, a 60/60 level saves money on payroll but is almost guaranteed to create frustrated customers and a damaged reputation. Setting the right, achievable Service Level is one of the most critical strategic decisions you'll make.
Understanding the Cost of Waiting
Two other crucial metrics are tied directly to how long customers are left hanging: Average Speed of Answer and Abandonment Rate.
- Average Speed of Answer (ASA): This is the average time a customer sits in the queue before a human picks up. It's the real-world measure of that "holding pattern" we talked about. A low, stable ASA is a clear sign of a well-run operation.
- Abandonment Rate: This is the percentage of callers who give up and hang up before ever speaking to an agent. Think of it as a direct measure of customer impatience. If this number starts creeping up, it’s a massive red flag that your wait times are pushing people past their breaking point.
A high Abandonment Rate isn’t just a lost call; it’s a lost opportunity. It represents a customer whose frustration peaked, a potential sale that vanished, or a service issue that will now fester and likely require even more effort to resolve later.
This constant drive for efficiency is critical. In Poland, for instance, the call centre industry has exploded into a major economic player, with a market size estimated at €668 million. With over 2,000 businesses in the mix, operational excellence isn't just a nice-to-have; it's a matter of survival. You can learn more about this competitive environment in this detailed industry analysis.
KPI Benchmarks for Operational Efficiency
Knowing the industry standards is key to understanding where you stand. The table below shows typical benchmarks for these operational KPIs, giving you a yardstick to measure your own performance against.
| Operational KPI | Industry Low Performer | Industry Average | Industry High Performer |
|---|---|---|---|
| Service Level | < 60/60 | 80/30 | 80/20 or better |
| Abandonment Rate | > 10% | 5% - 8% | < 5% |
| Average Speed of Answer (ASA) | > 60 seconds | 20 - 30 seconds | < 20 seconds |
These benchmarks provide a clear target. If your numbers are in the "Low Performer" column, it's a clear signal that you have work to do. High performers aren't just lucky; they are actively managing these metrics.
Ultimately, these numbers do more than just flag problems—they point you toward solutions. A high ASA might tell you to rethink staffing during peak hours or to improve your IVR to route calls more effectively. A high Abandonment Rate could be the trigger to finally implement a callback option, giving customers back their time and control. For a deeper dive, our guide on improving call centre quality assurance offers more practical strategies.
Bringing Your KPIs to Life with Modern Tools
Collecting data on your call centre KPIs is one thing, but actually using that information to make smart, proactive decisions? That’s where the real impact is made. Modern tools are closing that gap, turning what used to be static reports into a living, breathing guide for improvement.
Imagine going from spot-checking a few random calls for quality to having a deep understanding of every single customer conversation. That's no longer science fiction; it's what AI-powered platforms deliver. They don't just track your metrics; they give them context by automatically analysing 100% of your interactions.
This completely changes the game for managers. Instead of reacting to problems days or even weeks after the fact, you can finally get ahead of them and manage your team in the moment.
From Reactive to Proactive Leadership
Let's look at what this means in practice. A manager sees her team's First Call Resolution (FCR) rate take a small but sudden dip. In the old days, her next steps would have been slow and manual. She'd have to schedule a round of one-on-one meetings, listen to a small sample of calls, and basically make an educated guess about what was going wrong.
With a modern AI tool, her workflow looks entirely different:
- Instant Diagnosis: The platform doesn't just flag the FCR drop; it connects the dots. It instantly shows a correlation with a spike in calls about a new product feature and analyses the sentiment and language being used.
- Pinpointing the Real Issue: AI-driven speech analytics quickly uncovers the root cause. It’s not one underperforming agent. It's a team-wide knowledge gap, with several agents giving slightly different or incorrect answers about the new feature.
- Deploying a Quick Fix: The manager can act immediately. She puts together a quick micro-training session—maybe a short video and a one-page guide—to clarify the feature's details. She then pushes it out to the entire team's dashboard.
This is the essence of proactive management. A systemic issue was identified and a targeted solution was rolled out across the entire team in minutes, not weeks, preventing the problem from snowballing and affecting thousands more customers.
This is a massive shift away from constantly putting out fires. It’s about using data to lead with foresight. You can solve issues before they escalate, give your agents the exact support they need when they need it, and consistently raise the bar for your customer experience. By embracing these tools, you can automate customer support routines and let your team focus on the complex, human-centric conversations that matter most. Your KPIs are no longer just a look in the rearview mirror; they become your live roadmap to a smarter, more responsive call centre.
Frequently Asked Questions About Call Centre KPIs
Even when you know what to measure, turning that knowledge into a real-world strategy is where the real questions pop up. Let's tackle some of the most common queries that come up when you move from theory to practice, so you can start applying these ideas effectively.
How Often Should We Review Our Call Centre KPIs?
There’s no magic number here. The right review schedule really depends on what you're trying to achieve with a specific metric. Think of it like your car's dashboard – you glance at your speed constantly, but you probably only check the tyre pressure every so often.
- Daily: For your operational pulse, metrics like Service Level and Average Speed of Answer (ASA) need a daily look. These are your immediate health checks that tell you if you have enough people on deck to handle the day's queues.
- Weekly: This is the sweet spot for team performance metrics. Reviewing things like Average Handle Time (AHT) and agent-specific First Call Resolution (FCR) on a weekly basis gives managers enough data to see trends and pinpoint coaching needs without feeling like they're micromanaging.
- Monthly or Quarterly: Big-picture goals tied to Net Promoter Score (NPS) and Customer Satisfaction (CSAT) need more time to bake. Looking at these over a longer period helps you see beyond daily fluctuations and understand the real impact of your strategic efforts on customer happiness.
Which Single KPI Is the Most Important to Track?
If you had to pick just one, which would it be? While it always comes back to your specific business goals, First Call Resolution (FCR) is arguably the most powerful, all-encompassing metric you can track. It’s a fantastic indicator because it tells a story about so many different parts of your operation at once.
A high FCR means your agents are well-trained, your internal processes are working smoothly, and your customers are getting what they need without the frustration of calling back. It's a win-win that cuts down on costly repeat calls while directly improving customer satisfaction, making it the ultimate health check for your call centre.
How Do We Start Tracking KPIs with No System in Place?
Starting from zero can feel like a huge task, but you don't need a massive, complicated system from day one. The secret is to start small and build momentum. Aim for progress, not instant perfection.
Here’s a simple way to get the ball rolling:
- Pick 3-5 Core KPIs: Don't overwhelm yourself. Start with a handful of foundational metrics like FCR, CSAT, and AHT.
- Check Your Current Tools: You might be surprised by what you already have. Most modern contact centre platforms have some level of built-in reporting. Dig in and see what data is already at your fingertips.
- Set a Baseline: For one month, just track. Don't try to fix anything yet. This gives you an honest starting point, a baseline that will show you just how much you're improving later on.
Ready to turn those KPI numbers into a clear plan for improvement? Voicetta uses AI to analyse 100% of your customer conversations, uncovering the insights you need to sharpen performance and grow your business. Discover what you've been missing at Voicetta.com.