In the world of customer service, what you can't measure, you can't improve. Moving beyond simple call counts, modern call centres thrive on a sophisticated set of performance indicators that paint a complete picture of efficiency, quality, and customer loyalty. These metrics are not just numbers on a dashboard; they are the narrative of your customer's journey and the blueprint for operational excellence.
Understanding and mastering the core call centre KPIs is the difference between being a reactive cost centre and becoming a proactive driver of business growth. These vital signs reveal everything from agent performance to customer sentiment, highlighting opportunities for targeted improvement. They allow managers to make informed decisions that directly enhance service delivery and bolster the bottom line.
This guide delves into the most critical KPIs, providing the definitions, formulas, industry benchmarks, and actionable strategies you need to transform your operations. We will explore how to balance efficiency metrics like Average Handle Time with crucial quality indicators such as First Call Resolution and Customer Satisfaction. By the end, you will have a clear framework for turning raw data into a powerful tool for elevating every customer interaction.
1. First Call Resolution (FCR)
Often hailed as the king of call centre KPIs, First Call Resolution (FCR) measures the percentage of customer issues resolved entirely during the first contact. It’s a powerful indicator of both operational efficiency and customer satisfaction, reflecting your team's ability to deliver a complete, one-and-done solution. Getting this right means customers don't need to call back, follow up with an email, or get transferred, saving everyone time and frustration.

A high FCR rate directly correlates to a better customer experience and lower operational costs. When customers get their problems solved quickly, their loyalty deepens. For the business, resolving issues on the first attempt reduces the volume of repeat calls, freeing up agents to handle new customer queries.
How to Implement and Improve FCR
Calculating FCR is straightforward: (Total Resolved Calls on First Contact / Total Number of Unique Calls) x 100. The challenge lies in creating an environment where agents can consistently achieve it.
- Empower Your Agents: Companies like Zappos excel at FCR by giving agents the authority to make decisions. This might mean issuing a refund or offering a replacement without needing a manager's approval, cutting out escalations.
- Leverage Technology: American Express improved its FCR by 15% using predictive analytics to route calls to the most qualified agent. Intelligent call routing ensures complex technical questions go to tech specialists, while billing queries are handled by finance experts.
- Build a Robust Knowledge Base: A centralised, easy-to-search knowledge management system is non-negotiable. It equips agents with instant access to accurate information, procedures, and troubleshooting guides.
- Analyse Failures: Regularly review calls that were not resolved on the first attempt. Identify common patterns, knowledge gaps, or process bottlenecks to target for improvement.
2. Average Handle Time (AHT)
Average Handle Time (AHT) is a cornerstone of call centre KPIs, representing the average duration of a single customer interaction from start to finish. This includes the initial conversation, any hold time, and the post-call wrap-up work agents complete. AHT is a crucial measure of operational efficiency and is fundamental for resource planning, staffing, and cost management.

While a lower AHT often suggests greater efficiency, it must be balanced carefully against customer satisfaction. Rushing an agent to get off a call can lead to unresolved issues and a poor customer experience, defeating the purpose of efficiency. The goal isn't just to be fast; it's to be effectively and efficiently thorough, making AHT a key metric for optimising the balance between speed and service quality.
How to Implement and Improve AHT
The formula for AHT is comprehensive: (Total Talk Time + Total Hold Time + Total After-Call Work) / Total Number of Calls. Improving it requires a strategic approach that streamlines processes without sacrificing the quality of the interaction.
- Balance with Quality Metrics: Never track AHT in isolation. Pair it with Customer Satisfaction (CSAT) and First Call Resolution (FCR) scores to ensure that efficiency gains don't come at the expense of service quality. This creates a holistic view of agent performance.
- Optimise Agent Tools and Processes: Southwest Airlines managed to reduce its AHT by an impressive 23% by automating repetitive tasks and improving the tools its agents use. A streamlined CRM and an integrated knowledge base can significantly cut down on search and after-call work time.
- Set Differentiated Targets: Not all calls are equal. Best Buy's Geek Squad set different AHT targets for various levels of technical support. Simple queries naturally have shorter handle times than complex troubleshooting, and your targets should reflect this reality.
- Use Analytics for Coaching: T-Mobile leveraged speech analytics to pinpoint specific phrases or parts of calls where agents were inefficient. This data provides concrete, actionable insights for targeted coaching sessions, helping agents improve their communication and problem-solving speed.
3. Customer Satisfaction Score (CSAT)
While metrics like FCR focus on operational efficiency, the Customer Satisfaction Score (CSAT) goes straight to the source, asking a simple yet powerful question: "How satisfied were you with your interaction today?" This KPI provides direct, quantifiable feedback on how customers perceive the service they received. It’s a vital pulse-check on agent performance and the overall quality of the customer experience, making it one of the most crucial call centre KPIs to track.

A high CSAT score indicates that your team is not just resolving issues, but doing so in a way that leaves customers feeling valued and heard. This positive sentiment is a strong driver of loyalty and positive word-of-mouth. Tracking CSAT helps identify both high-performing agents who can serve as models and specific interactions that require coaching or process improvements, enabling targeted quality assurance efforts.
How to Implement and Improve CSAT
Calculating CSAT is typically done by asking customers to rate their satisfaction on a scale (e.g., 1-5). The score is then calculated as: (Number of Satisfied Customers / Total Number of Survey Responses) x 100. A "satisfied customer" is usually someone who provides a top-tier rating (e.g., 4 or 5).
- Empower Creative Solutions: High-end retailer Nordstrom maintains exceptional CSAT scores by giving agents the flexibility to resolve issues creatively, free from rigid scripts. This empowerment allows them to tailor solutions to the individual customer, fostering genuine satisfaction.
- Personalise the Experience: Financial services company USAA consistently achieves CSAT scores over 95% by equipping agents with comprehensive customer data. This allows for a highly personalised service where agents understand the customer’s history and needs, making the interaction feel more like a conversation than a transaction.
- Keep Surveys Short and Immediate: To maximise response rates, trigger a short, single-question survey via SMS or email immediately after the call ends. Apple excels here, often using a simple 1-5 scale to capture feedback while the experience is still fresh in the customer's mind.
- Act on Feedback Rapidly: Use real-time feedback systems to flag poor scores for immediate follow-up. A manager can review the call and contact the customer to resolve the issue, turning a negative experience into a positive one and demonstrating that your organisation values their feedback. For a deeper dive into the nuances of this metric, you can learn more about measuring customer satisfaction.
4. Net Promoter Score (NPS)
Moving beyond individual interaction metrics, Net Promoter Score (NPS) gauges long-term customer loyalty and sentiment. It answers a crucial question: "How likely are you to recommend our company/service to a friend or colleague?" This KPI, popularised by Fred Reichheld of Bain & Company, is a powerful predictor of business growth because it measures a customer's overall relationship with your brand, not just their satisfaction with a single call.
A strong NPS indicates that your call centre is not just solving problems but creating brand advocates. For instance, Tesla's customer service helps drive its industry-leading NPS of 96, turning satisfied owners into a volunteer sales force. Similarly, Costco's consistent service quality contributes to its high NPS of 79, fostering immense loyalty. A high score is one of the most valuable call centre KPIs as it directly links service interactions to revenue growth and word-of-mouth marketing.
The following chart illustrates how NPS is calculated by categorising respondents and subtracting the percentage of Detractors from the percentage of Promoters.
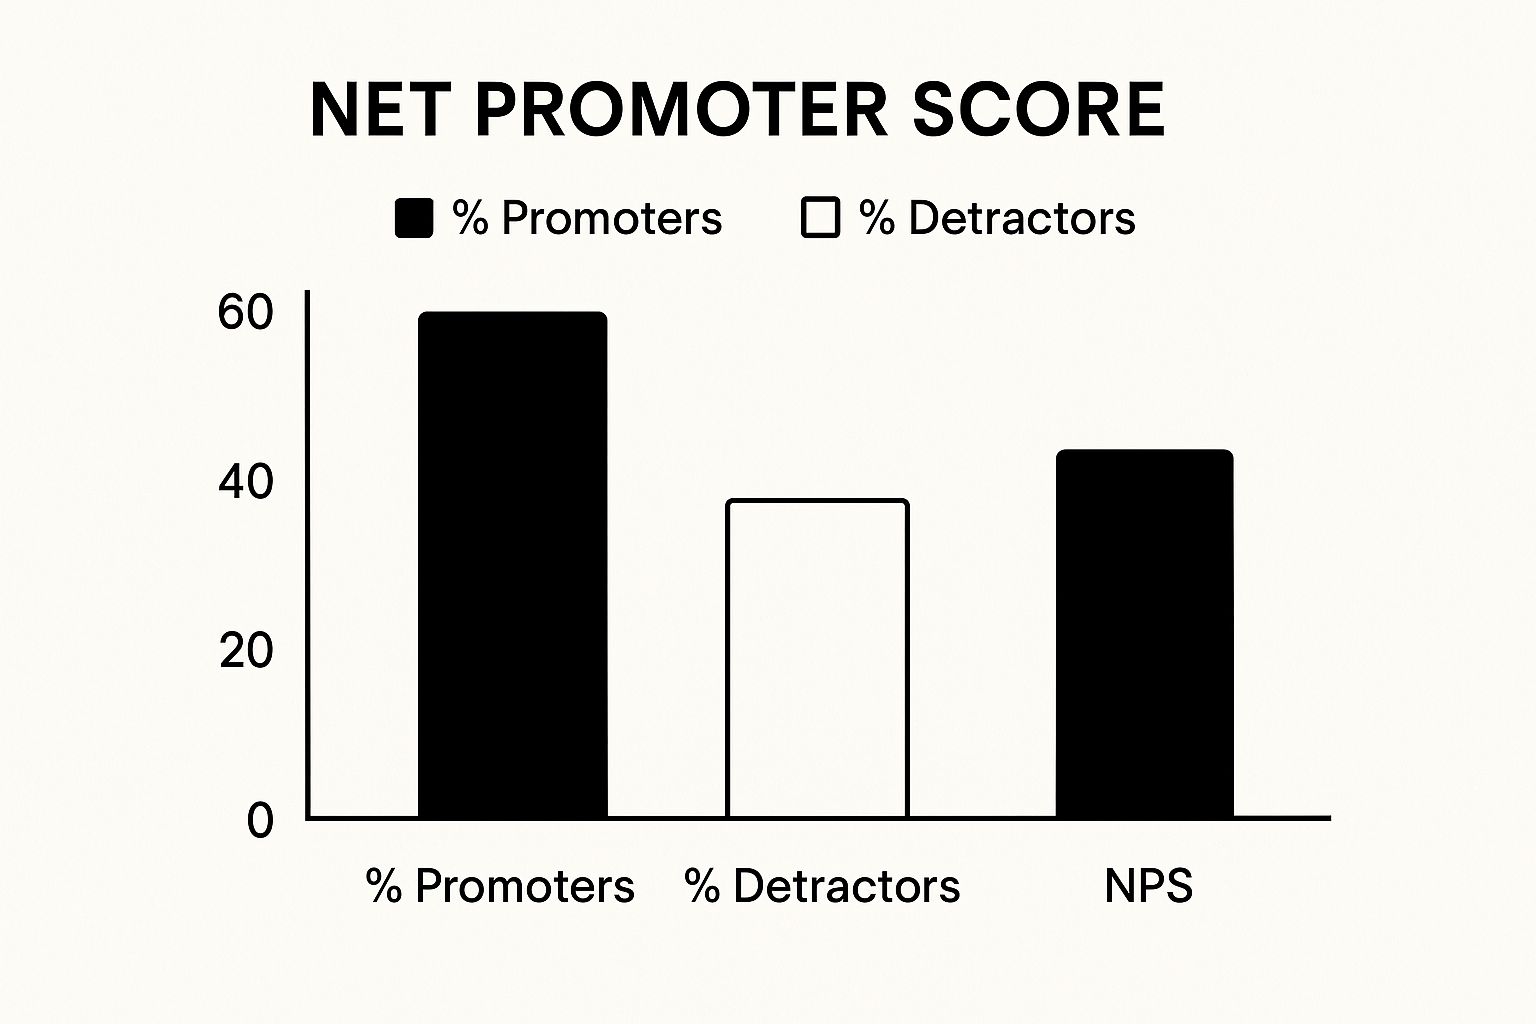
As the bar chart shows, with 60% Promoters and 20% Detractors, the final NPS is a solid +40, highlighting a healthy base of loyal customers.
How to Implement and Improve NPS
Calculating NPS begins with a 0-10 scale survey. Respondents are grouped as Promoters (9-10), Passives (7-8), or Detractors (0-6). The formula is: (% of Promoters - % of Detractors) = NPS.
- Collect Data Consistently: Survey customers regularly (e.g., quarterly) and after key interactions to track trends. This allows you to measure the impact of service changes over time.
- Segment Your Feedback: Don't just look at the overall score. Analyse NPS by customer demographic, product line, or even the agent who handled the call to pinpoint specific strengths and weaknesses.
- Follow Up Strategically: Create a closed-loop feedback process. Contact Detractors within 24 hours to understand their issues and attempt a service recovery. Reach out to Promoters to learn what you're doing right and ask for testimonials or reviews.
- Empower the Frontline: Share NPS feedback directly with your agents. This gives them ownership of the customer experience and helps them understand how their performance contributes to customer loyalty, not just call handling times.
5. Service Level
Service Level is a cornerstone of call centre KPIs, measuring the percentage of calls answered within a predefined time limit. It's typically expressed as 'X% of calls answered in Y seconds' and acts as a crucial barometer for a centre's responsiveness and accessibility. This metric is fundamental to managing customer expectations, as it directly reflects how long a customer has to wait before speaking to an agent.
A strong service level indicates that you have adequate staffing and efficient processes to handle incoming call volume promptly. For customers, a quick answer time translates to a more positive initial experience, reducing the frustration that comes from being stuck on hold. For the business, it's about striking the perfect balance between operational costs and maintaining high standards of customer care, a key challenge in call centre management.
How to Implement and Improve Service Level
Calculating Service Level is direct: (Number of Calls Answered Within Threshold / Total Number of Calls Offered) x 100. The real strategy lies in designing and maintaining systems that can consistently meet your target.
- Set Tiered and Realistic Goals: Not all customer interactions are equal. Chase Bank, for example, uses different service levels for different customer segments, offering a premium 85/15 (85% of calls answered in 15 seconds) for high-value clients and a standard 80/20 for others. This prioritises resources where they have the most impact.
- Utilise Workforce Management (WFM) Software: Accurate forecasting is key. WFM software analyses historical data to predict call volumes, allowing you to create precise staffing schedules that align with demand, including seasonal peaks and marketing campaign surges. Delta Airlines uses dynamic staffing models to maintain a 90/30 service level even during busy travel seasons.
- Implement Real-Time Monitoring: Use dashboards to track service levels throughout the day. This visibility allows supervisors to make immediate adjustments, such as reallocating agents from outbound tasks to inbound queues when wait times start to climb, as Verizon does to maintain its 80/20 standard.
- Balance with Other Metrics: Aiming for an aggressive service level, like 95/10, can lead to agent burnout and increased costs. It's vital to balance this KPI with metrics like agent occupancy and cost per call to ensure operational health. Explore how powerful call centre analytics can help you find this equilibrium.
6. Call Abandonment Rate
The Call Abandonment Rate is a critical metric that reveals the percentage of callers who hang up before ever speaking to an agent. This KPI serves as a direct measure of customer frustration and highlights potential failures in your queue management and staffing. A high abandonment rate often signifies excessive wait times, inefficient call routing, or a poor initial customer experience, translating directly into lost leads and damaged brand perception.
Keeping this rate low is fundamental among call centre KPIs because it ensures customers who actively seek help are able to connect with your team. Every abandoned call is a missed opportunity to solve a problem or make a sale. Companies that successfully manage this metric not only improve customer satisfaction but also maximise their operational ROI by ensuring their staffed agents are utilised effectively.
How to Implement and Improve Call Abandonment Rate
The formula is a core part of performance tracking: (Number of Abandoned Calls / Total Number of Incoming Calls) x 100. Improving it requires a strategic approach to managing the customer's waiting experience.
- Offer Queue Callback Options: Comcast famously reduced its abandonment rate from 12% to under 4% by implementing technology that allows customers to request a callback instead of waiting on hold. This respects the customer's time and drastically reduces queue frustration.
- Provide Accurate Wait Time Estimates: American Airlines managed to lower its abandonment rate by 25% by using queue messaging to provide realistic estimated wait times. Setting clear expectations helps customers make an informed decision to wait, significantly reducing premature hang-ups.
- Optimise Call Routing and Staffing: Progressive Insurance maintains an impressive abandonment rate below 3% by using predictive dialling and overflow routing during peak hours. This ensures calls are distributed efficiently, even during unexpected surges in volume.
- Analyse Abandonment Patterns: Dig into your data to identify when abandonment peaks. Are calls being dropped most often after 5 minutes? During lunch hours? Use these insights to adjust staffing schedules or IVR messaging to address specific problem periods.
7. Quality Score
While efficiency metrics like AHT and FCR are crucial, they don't tell the whole story. Quality Score provides a comprehensive evaluation of an agent's performance, assessing the how behind the what. It measures customer interaction quality through call monitoring, scorecards, and standardised criteria, ensuring agents maintain high standards for communication, empathy, and procedural adherence. This is one of the most vital call centre KPIs for balancing speed with service excellence.
A high Quality Score signifies that agents are not just closing tickets but are creating positive, brand-affirming experiences. It ensures compliance is met, misinformation is minimised, and the customer feels heard and valued. For managers, it provides a structured framework for coaching and identifying specific areas for agent development, moving beyond purely quantitative measures to foster genuine service talent.
How to Implement and Improve Quality Score
Calculating Quality Score involves evaluating recorded interactions against a predefined scorecard: (Total Points Scored / Total Possible Points) x 100. The real work lies in creating a fair, consistent, and developmental quality assurance programme.
- Use Standardised Evaluation Forms: Create a clear, objective scorecard with defined criteria for areas like greeting, problem identification, active listening, solution accuracy, and closing. Ensure every evaluator uses the same form to maintain consistency.
- Implement Calibration Sessions: Regularly bring your quality assessors together to score the same call and discuss their reasoning. This process aligns evaluators, reduces subjectivity, and ensures that scores are applied fairly across the entire team. Marriott, for instance, uses advanced speech analytics to monitor 100% of calls against quality standards, then uses this data for targeted calibration.
- Provide Regular, Actionable Feedback: Don't just deliver a score; use it as a coaching tool. Sit down with agents to review their calls, highlight what they did well, and collaboratively identify specific areas for improvement. Wells Fargo supplements its formal monitoring with peer reviews and self-assessments to foster a culture of continuous development.
- Balance Monitoring with Empowerment: A strong quality programme should feel supportive, not punitive. Ritz-Carlton achieves world-class quality scores by empowering its employees with extensive training and the authority to resolve issues creatively, building agent confidence and competence. For a deeper dive into this area, you can learn more about call centre quality assurance on voicetta.com.
8. Agent Utilization Rate
Agent Utilization Rate is a critical workforce optimisation metric that measures the percentage of an agent's logged-in time spent on call-related activities compared to their total available time. It’s a key indicator of productivity and efficiency, revealing how effectively your workforce is being deployed. Getting this balance right is crucial for managing operational costs without burning out your team.
A healthy Agent Utilization Rate ensures you are maximising your staffing investment. It helps managers understand if agents are being overworked with constant back-to-back calls or if there's excessive idle time, which could indicate overstaffing or inefficient call routing. This metric is fundamental to achieving a lean, yet effective, operational model.
How to Implement and Improve Agent Utilization Rate
The formula is simple: (Total time on call-related activities / Total logged-in time) x 100. The real challenge is finding the optimal rate, which is typically between 75-85%, not 100%. This sweet spot ensures agents are productive while still having necessary time for breaks, training, and post-call work.
- Set Realistic Targets: Aiming for 100% utilisation is a recipe for agent burnout and a decline in service quality. Companies like AT&T maintain around 85% utilisation by using advanced workforce management systems and flexible scheduling to match agent availability with predicted call volumes.
- Optimise with Technology: Global BPOs such as Teleperformance optimise utilisation across different centres by using real-time routing. If one centre experiences a surge, calls are automatically redirected to another with available agents, balancing the load and keeping utilisation steady.
- Balance with Other KPIs: Never analyse utilisation in a vacuum. Track it alongside Customer Satisfaction (CSAT) and First Call Resolution (FCR). A high utilisation rate is meaningless if quality and customer happiness are plummeting.
- Prioritise Agent Wellbeing: Avoid scheduling agents for relentless back-to-back calls. Concentrix (formerly Convergys) uses utilisation data to implement flexible work arrangements, ensuring productivity targets are met while protecting agent wellbeing. This proactive approach helps to improve agent productivity sustainably.
Key KPI Metrics Comparison for Call Centers
| Metric | Implementation Complexity 🔄 | Resource Requirements 💡 | Expected Outcomes 📊 | Ideal Use Cases 💡 | Key Advantages ⭐ |
|---|---|---|---|---|---|
| First Call Resolution (FCR) | Moderate - requires tracking systems and clear resolution definitions | Medium - training, knowledge management systems | Improved customer satisfaction and loyalty; reduced repeat contacts | Customer service centers aiming to resolve issues on first contact | Enhances agent productivity; lowers operational costs |
| Average Handle Time (AHT) | Moderate - integrated with workforce management | Medium - tools for call tracking and analysis | Balanced efficiency and quality; optimized staffing | Managing operational efficiency and scheduling | Supports workforce planning; identifies inefficiencies |
| Customer Satisfaction Score (CSAT) | Low - survey deployment and collection systems | Low to Medium - varied survey channels | Direct customer feedback on service quality | Measuring customer experience post-interaction | Provides actionable feedback; supports agent coaching |
| Net Promoter Score (NPS) | Low - simple survey question and calculation | Low - regular survey collection | Insights into customer loyalty and business growth | Tracking long-term customer loyalty and growth | Standardized metric; predicts retention and churn |
| Service Level | Low to Moderate - real-time monitoring tools | Medium - forecasting and staffing systems | Reduced wait times; improved customer experience | Operational management and staffing optimization | Easy to communicate; ties directly to customer satisfaction |
| Call Abandonment Rate | Low - call tracking systems | Low - monitoring software | Identifies lost opportunities and customer frustration | Managing wait times and call routing efficiency | Helps optimize staffing and reduce call loss |
| Quality Score | High - requires detailed monitoring and evaluation | High - evaluator training and monitoring tools | Maintains high service standards and agent development | Ensuring service quality and compliance | Supports consistent quality and coaching |
| Agent Utilization Rate | Moderate - workforce management integration | Medium - real-time tracking software | Maximizes agent productivity; balances workload | Workforce optimization and cost control | Identifies productivity gains and burnout risks |
From Metrics to Masterpiece: Building Your High-Performing Call Centre
Navigating the landscape of call centre KPIs can feel like deciphering a complex code. We've explored the individual threads of this narrative, from the immediate impact of First Call Resolution (FCR) and Average Handle Time (AHT) to the long-term loyalty indicators of Customer Satisfaction (CSAT) and Net Promoter Score (NPS). Each metric offers a unique lens through which to view your operation's health and effectiveness.
However, the true mastery of call centre performance isn't found in optimising one metric in isolation. It emerges from understanding their interconnectedness. Think of it as a delicate ecosystem: improving your agents' training to boost FCR doesn't just solve problems faster; it directly nourishes your CSAT scores and can organically reduce call volumes over time. Similarly, focusing solely on reducing AHT without considering Quality Scores can lead to rushed, incomplete interactions that damage customer trust and increase repeat calls, ultimately harming the very efficiency you sought to create.
The goal is to move beyond mere measurement and embrace a culture of continuous, data-informed improvement. The most successful call centres don't just track numbers; they interpret the stories behind them. They see a high Call Abandonment Rate not as a failure, but as an opportunity to analyse staffing levels, IVR complexity, or agent availability. They view Agent Utilisation Rate not as a whip for productivity, but as a tool for ensuring their team is engaged and supported, not overworked and burnt out.
Your Actionable Blueprint for Success
Transforming this knowledge into tangible results requires a clear path forward. Your next steps should be strategic and deliberate:
- Establish Your Baseline: Before you can improve, you must understand your current standing. Dedicate time to accurately measure and document your performance across these key call centre KPIs. This provides the crucial starting point for your journey.
- Align KPIs with Business Goals: Why are you tracking these metrics? Connect each KPI back to a broader organisational objective. Whether it's increasing customer retention, improving operational efficiency, or boosting brand reputation, this alignment gives your data purpose.
- Empower Your Team: Share these insights with your agents. When they understand why metrics like FCR and CSAT are important, they become active participants in the mission rather than just subjects of measurement. Use Quality Score feedback for constructive coaching, not criticism.
- Embrace Technology as an Ally: Manual tracking and analysis are no longer sufficient. Leverage modern call centre platforms to automate data collection, reveal trends, and provide real-time dashboards. This frees up leadership to focus on strategy and coaching, not number crunching.
Ultimately, building a high-performing call centre is a masterpiece in progress. It requires a balanced approach, a commitment to quality, and a deep understanding of the human element behind every call. By weaving these individual call centre KPIs into a cohesive strategy, you transform your support function from a cost centre into a powerful engine for customer loyalty and sustainable business growth. You create an operation that doesn't just answer calls, but builds relationships.
Ready to elevate your customer service and see your call centre KPIs soar? Discover how Voicetta's 24/7 AI-powered voice assistants can handle routine inquiries, slash wait times, and free your human agents to focus on high-value interactions. Transform your call centre into a strategic asset by visiting Voicetta to learn more.