Unlocking Customer Service Excellence: The Power of KPIs
Want to deliver outstanding customer service and boost your bottom line? This listicle reveals eight essential customer service performance indicators you need to track in 2025. Learn how monitoring KPIs like Customer Satisfaction Score (CSAT), Net Promoter Score (NPS), and Customer Effort Score (CES) can pinpoint areas for improvement, enhance customer loyalty, and drive revenue growth. We'll define each customer service performance indicator, explain its calculation, and highlight its business impact. Let's unlock your potential for customer service excellence.
1. Customer Satisfaction Score (CSAT)
Customer Satisfaction Score (CSAT) is a crucial customer service performance indicator that measures how satisfied customers are with a specific interaction, product, or service. It provides a direct line to the voice of your customer, offering immediate insight into their perception of service quality. CSAT surveys typically use a simple scale, such as 1-5 or 1-10, to gauge customer satisfaction immediately after an interaction. This allows businesses to quickly identify areas for improvement and address any negative experiences.
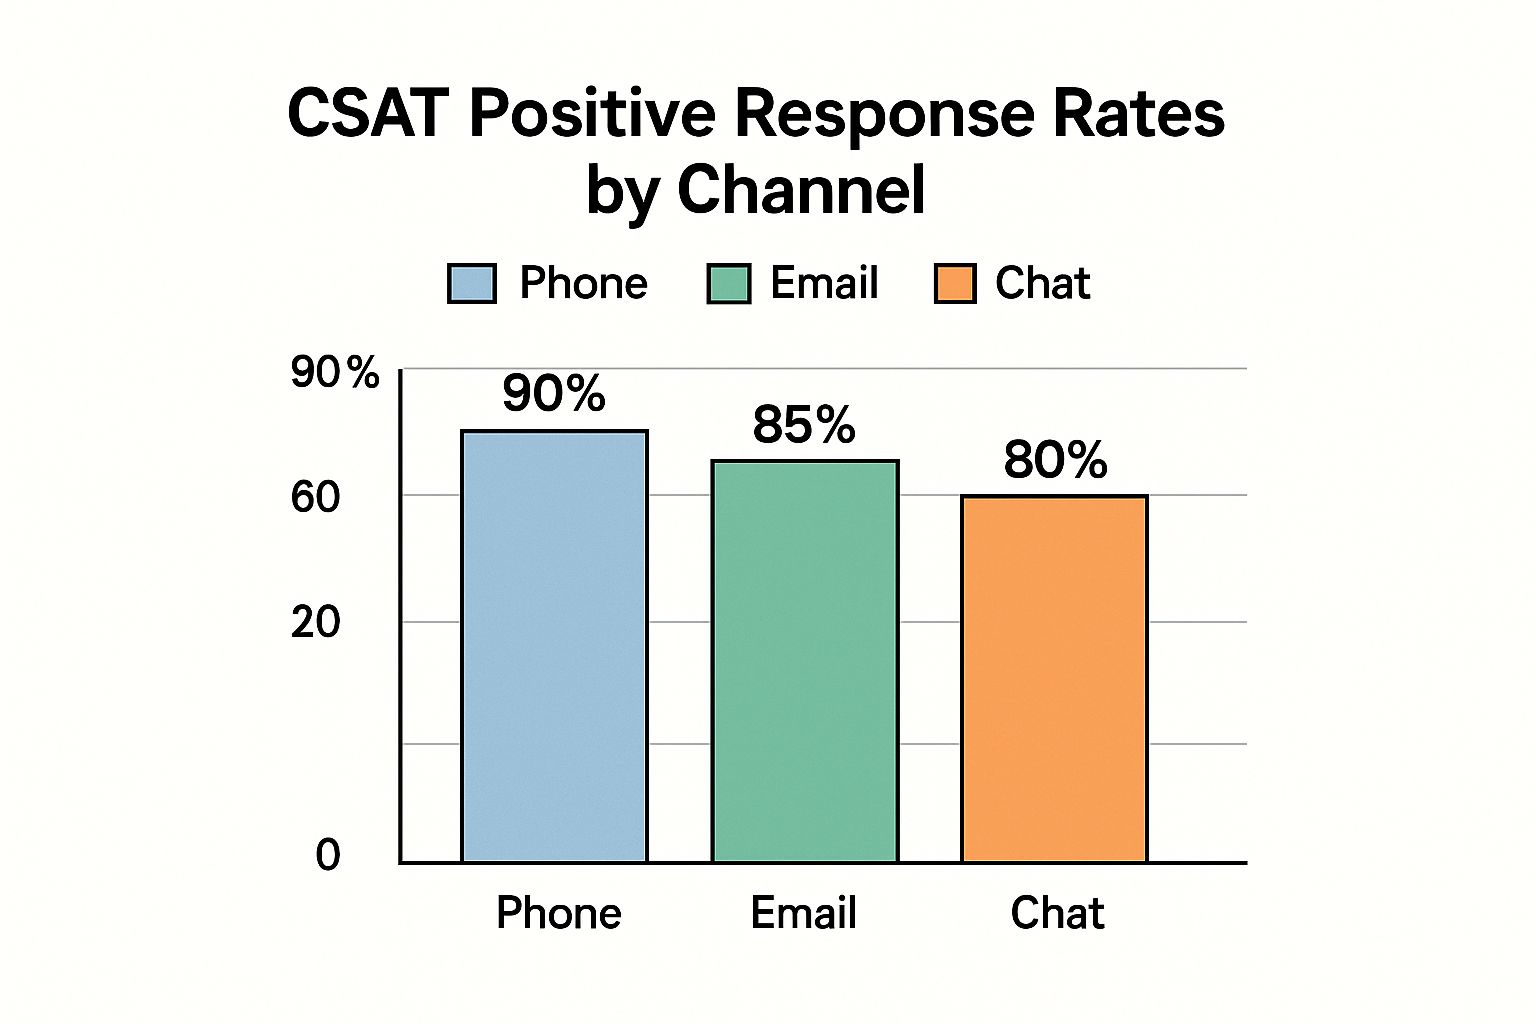
The infographic above visualizes key data related to CSAT, comparing the scores across different industries. As a bar chart, it clearly illustrates the average CSAT scores achieved in sectors like online retail, healthcare, and financial services. For instance, the chart might show that online retail tends to have higher CSAT scores compared to healthcare, potentially due to factors like easier return policies and readily available customer support. This allows businesses to benchmark their own CSAT performance against industry averages and identify areas for potential improvement. The visualization highlights the importance of CSAT as a key performance indicator and demonstrates how it can vary significantly across different sectors.
This metric's simplicity is a major advantage. It's easy to implement, understand, and explain to your team. Moreover, its direct tie to specific interactions makes it highly actionable for operational improvements. For example, if CSAT scores dip following a software update, you have immediate insight that the update might be causing usability issues. CSAT can be segmented by service type, department, or even individual agent, further enhancing its ability to pinpoint areas needing attention. You can also compare CSAT across different service channels (e.g., phone, email, chat) to identify which channels are performing well and which require optimization.
Examples of successful CSAT implementation abound. Amazon, renowned for its customer-centric approach, follows up purchases with simple CSAT surveys. Apple sends post-support interaction surveys after Genius Bar appointments, proactively seeking feedback to enhance their service experience. Zappos consistently uses CSAT to maintain its legendary reputation for exceptional service, showcasing how prioritizing customer satisfaction can be a key differentiator.
While CSAT provides invaluable feedback, it does have some limitations. It's susceptible to response bias, as dissatisfied customers are often more motivated to respond than satisfied ones. Additionally, CSAT captures a point-in-time measurement, which may not reflect the overall customer relationship or predict long-term loyalty. Learn more about Customer Satisfaction Score (CSAT)
Pros:
- Easy to implement and understand
- Provides immediate feedback on specific interactions
- Highly actionable for operational improvements
- Can be compared across different service channels
Cons:
- Subject to response bias (dissatisfied customers more likely to respond)
- Doesn't always correlate with customer loyalty
- Point-in-time measurement that may not reflect overall relationship
- Scale interpretations can vary between customers
Tips for Effective CSAT Implementation:
- Keep surveys short: 1-3 questions maximum.
- Time it right: Ask for feedback immediately after the service interaction.
- Gather qualitative data: Include an open-ended question for more detailed feedback.
- Set benchmarks: Establish clear internal benchmarks and targets for CSAT scores.
- Track trends: Focus on trends over time rather than individual scores.
CSAT deserves its place on the list of essential customer service performance indicators because it offers readily available, actionable insights into customer satisfaction levels. While it's not a perfect predictor of long-term loyalty, its immediacy and specificity make it an invaluable tool for identifying areas for operational improvement and enhancing the overall customer experience. For businesses across sectors, from hospitality professionals and real estate agents to healthcare providers and enterprise IT managers, understanding and leveraging CSAT is essential for achieving customer service excellence. For business owners, CEOs, and CTOs, CSAT data provides critical insights into the customer experience and can inform strategic decisions.
2. Net Promoter Score (NPS)
Among the most popular customer service performance indicators is the Net Promoter Score (NPS). This metric gauges customer loyalty and their willingness to recommend your company, providing a valuable snapshot of overall customer satisfaction. It hinges on a single, straightforward question: "How likely are you to recommend us to a friend or colleague?" Customers respond on a scale of 0 to 10, allowing you to categorize them into three groups: Promoters (9-10), Passives (7-8), and Detractors (0-6). Your final NPS is then calculated by subtracting the percentage of Detractors from the percentage of Promoters, resulting in a score ranging from -100 to +100.
This seemingly simple metric holds significant weight as a key customer service performance indicator because it provides a high-level view of customer sentiment. Its simplicity makes it easy to understand and implement across various departments, from customer support to marketing, and allows for benchmarking against competitors within and across industries. For executives, CEOs, and CTOs, NPS offers a quick, digestible measure of how the company is perceived by its customer base, connecting directly to potential for growth and revenue. For managers on the ground, like customer support managers, hospitality professionals, real estate agents, healthcare providers, and enterprise IT managers, NPS provides a quantifiable target to strive for and a basis for performance improvement initiatives.
The beauty of NPS lies in its simplicity and broad applicability. Companies like Apple consistently achieve NPS scores above 70, demonstrating the power of a loyal customer base. Similarly, Tesla maintains remarkably high scores, often exceeding 90 in some regions, illustrating how a strong product and customer experience can drive positive word-of-mouth. Even service-centric businesses like Ritz-Carlton leverage NPS as a core metric for their renowned customer experience programs.
However, relying solely on NPS has its drawbacks. While the score itself offers a general overview, it lacks specific actionable insights. This is where the often-included follow-up qualitative question, "Why did you give us this score?", becomes crucial. This open-ended response provides the context needed to understand the drivers behind the score and identify areas for improvement.
Furthermore, cultural biases can influence scoring. Some cultures are less inclined to give perfect 10s, impacting the overall score. It's also important to acknowledge that NPS, as a single metric, can oversimplify complex customer relationships and be susceptible to manipulation through selective surveying.
To maximize the value of NPS as a customer service performance indicator, consider these actionable tips:
- Always include a follow-up question: Understanding the "why" behind the score is critical for meaningful action.
- Consistent surveying: Don't limit surveys to post-positive interactions. Regular intervals provide a more holistic view.
- Close the loop with detractors: Proactive outreach by managers can transform negative experiences and build loyalty.
- Benchmarking: Compare your NPS against industry averages to understand your position in the market.
- Focus on trends: Rather than fixating on absolute numbers, track NPS trends to identify long-term improvements or declines.
Popularized by Fred Reichheld of Bain & Company, in conjunction with Satmetrix, and highlighted in the Harvard Business Review article "The One Number You Need to Grow", NPS remains a powerful tool for understanding customer loyalty and its impact on business growth. By understanding its strengths and limitations, and implementing the accompanying tips, businesses can effectively leverage NPS to enhance their customer service strategies and drive meaningful improvement.
3. First Contact Resolution (FCR)
First Contact Resolution (FCR) is a crucial customer service performance indicator that measures the percentage of customer issues resolved during the initial interaction, without the need for follow-up calls, emails, or transfers to other agents. It's a powerful metric because it directly reflects both operational efficiency and customer satisfaction. By minimizing customer effort and reducing the time and resources spent on repeated contacts, FCR contributes significantly to a positive customer experience and a healthier bottom line. A high FCR rate generally indicates a well-trained team, efficient processes, and a robust knowledge base. It's a key indicator for any business striving to deliver exceptional customer service.

FCR applies across all communication channels, including phone, email, chat, and social media. It's typically expressed as a percentage. For example, an FCR of 75% means that three out of four customer issues are resolved on the first contact. This metric can be tracked through CRM systems, helpdesk software, or post-interaction customer surveys. Imagine a customer calling your support line with a simple billing question. If the agent can access the necessary information and resolve the issue immediately, that counts as a successful first contact resolution. Conversely, if the agent needs to escalate the issue, transfer the call, or promise a callback, the FCR for that interaction is unsuccessful.
Several industry giants have demonstrated the power of prioritizing FCR. American Express, known for its exceptional customer service, has reportedly achieved FCR rates exceeding 90% through comprehensive agent training and empowerment. Verizon improved its FCR by implementing advanced knowledge base systems that provide agents with quick access to relevant information. TD Bank monitors FCR as a key performance indicator for its contact centers, recognizing its impact on customer loyalty and operational costs.
Pros:
- Directly correlates with customer satisfaction: Resolved issues on the first try lead to happier customers.
- Reduces operational costs: Fewer repeat contacts mean lower agent workload and reduced resource utilization.
- Identifies training opportunities: Low FCR rates can pinpoint areas where agents require additional training or where knowledge gaps exist.
- Improves overall service efficiency: Streamlined processes and effective issue resolution contribute to greater efficiency.
Cons:
- Complex issues may not be suitable for FCR targets: Some issues inherently require multiple interactions for resolution.
- May encourage rushed or incomplete resolutions to meet targets: Focusing solely on FCR can incentivize agents to prioritize speed over quality.
- Difficult to measure consistently across channels: Defining "resolution" can vary depending on the communication medium.
- Can be challenging to define what constitutes 'resolved': A clear and consistent definition of resolution is essential for accurate measurement.
Tips for Improving FCR:
- Clearly define "resolution": Establish specific criteria for what constitutes a resolved issue for different issue types.
- Implement robust knowledge management systems: Equip agents with easy access to the information they need.
- Empower frontline staff: Give agents the authority to resolve common issues without escalation.
- Use call recording and quality monitoring: Validate FCR data and identify areas for improvement.
- Balance FCR goals with other metrics: Consider handle time and customer satisfaction scores to ensure a holistic approach.
FCR deserves a prominent place in any list of customer service performance indicators due to its direct link to both customer satisfaction and operational efficiency. By focusing on resolving customer issues on the first contact, businesses can significantly enhance their customer experience, reduce costs, and improve overall performance. Learn more about First Contact Resolution (FCR)
This approach is particularly valuable for Customer Support Managers, Hospitality Professionals, Real Estate Agents, Healthcare Providers, Enterprise IT Managers, business owners, CEOs, and CTOs as it impacts the core of customer interaction and business efficiency. The concept of FCR was popularized by organizations like SQM Group (Service Quality Measurement) and COPC Inc. (Customer Operations Performance Center), as well as by Jeff Bezos' customer-centric approach at Amazon.
4. Average Resolution Time (ART)
Average Resolution Time (ART) is a crucial customer service performance indicator that measures the average time it takes to completely resolve a customer issue, from the initial point of contact to the final resolution. This metric provides a holistic view of the entire customer service journey, encompassing wait times, handling time, and any necessary follow-up. For businesses striving to optimize their customer service operations and minimize customer effort, understanding and actively managing ART is essential. This is why it deserves a prominent place on the list of critical customer service performance indicators.
Imagine a customer contacting your support team with a complex technical issue. They navigate through an interactive voice response (IVR) system, wait in a queue, explain their problem to an agent, and potentially get transferred to another department for specialized assistance. ART captures the total time elapsed throughout this entire process, providing valuable insights into efficiency and areas for improvement.
ART isn't just about speed; it's about understanding and optimizing the entire resolution process. Its features include:
- End-to-End Measurement: It measures the total time taken to resolve issues, not just isolated segments.
- Comprehensive Time Components: Includes wait time, handling time, and follow-up time.
- Granular Analysis: Can be broken down by issue type (e.g., billing, technical), department (e.g., sales, support), or complexity (e.g., tier 1, tier 2).
- Standard Measurement: Usually measured in hours or days, facilitating comparisons and benchmarking.
Why Use ART?
ART provides a clear picture of your customer service efficiency and helps identify bottlenecks in your resolution processes. By tracking ART, you can:
- Set Realistic Expectations: Inform customers about expected resolution timeframes, reducing anxiety and improving transparency.
- Identify Areas for Improvement: Pinpoint specific stages in the resolution process that contribute to longer resolution times.
- Correlate with Customer Effort Score: ART often correlates strongly with customer effort score, offering insights into how arduous it is for customers to get their issues resolved.
- Benchmark Performance: Track ART over time to measure the impact of process improvements and initiatives.
Pros of using ART:
- Holistic View: Provides a comprehensive understanding of the customer service experience.
- Bottleneck Identification: Helps identify bottlenecks in resolution processes.
- Realistic Expectations: Helps set realistic customer expectations for resolution timeframes.
- Correlation with Customer Effort: Correlates strongly with customer effort score.
Cons of using ART:
- Tracking Complexity: Can be complex to track across multiple touchpoints and systems.
- Issue Complexity Variations: May not fully account for variations in issue complexity.
- Pressure for Premature Resolution: Can create pressure to resolve issues prematurely to meet targets.
- Sophisticated Systems Required: Requires sophisticated tracking systems for accurate measurement.
Examples of Successful Implementation:
- Salesforce: Reduced ART by 25% through AI-powered case routing, directing customer inquiries to the most appropriate agent.
- Dell: Implemented tiered resolution targets based on issue complexity, ensuring appropriate service levels for different issue types.
- Zendesk: Uses ART as a benchmark for customer service platform performance, constantly striving to improve resolution efficiency.
Tips for Optimizing ART:
- Segment by Issue Type and Complexity: Analyze ART separately for different issue types and complexity levels to identify specific areas for improvement.
- Reduce Handoffs: Focus on reducing unnecessary handoffs between departments, streamlining the resolution process.
- Clear Escalation Paths: Create clear escalation paths for complex issues, ensuring timely resolution by specialized agents.
- Automated Status Updates: Use automation to provide customers with regular status updates, keeping them informed and reducing anxiety.
- Balance Speed with Quality: While speed is important, prioritize the quality of resolution to avoid re-contacts and ensure customer satisfaction.
Popularized By: ICMI (International Customer Management Institute), Gartner (customer service research), ServiceNow (IT service management).
By understanding and actively managing Average Resolution Time, businesses can significantly improve customer satisfaction, reduce operational costs, and create a more efficient and effective customer service organization.
5. Customer Effort Score (CES)
Customer Effort Score (CES) is a crucial customer service performance indicator that measures the ease with which customers can interact with your business and resolve their issues. Unlike traditional satisfaction surveys, CES focuses on the effort customers expend rather than their overall happiness. This approach stems from the understanding that reducing customer effort is a stronger predictor of loyalty and future purchases than simply exceeding expectations. A low-effort experience fosters trust and encourages repeat business, while a high-effort experience can quickly erode customer relationships. Imagine sailing through a smooth transaction versus navigating a frustrating maze of phone menus and unhelpful representatives – which scenario makes you more likely to return? CES helps you identify and eliminate those frustrating mazes.

Typically, CES is measured through a simple survey question like, "How easy was it to get your issue resolved?" Customers respond on a scale, typically ranging from 1 (very difficult) to 5 (very easy) or 1 to 7. This straightforward approach provides a clear, quantifiable measure of customer effort. This metric can be captured at various touchpoints throughout the customer journey, from initial contact to post-sale support, or even assessed across the entire customer relationship. Often, follow-up questions are included to pinpoint specific friction points and gather deeper insights. For example, after asking about the overall ease of resolution, you might ask, "Were you easily able to find the information you needed on our website?"
Why CES Deserves its Place in the List of Customer Service Performance Indicators:
CES offers a potent combination of simplicity and actionable insight. It directly addresses a critical driver of customer loyalty – ease of interaction. By focusing on effort reduction, businesses can proactively improve customer journeys and build stronger, longer-lasting relationships. For roles ranging from customer support managers and hospitality professionals to real estate agents, healthcare providers, and even enterprise IT managers, understanding and leveraging CES can be transformative.
Features and Benefits:
- Measured on a scale: The standardized scale allows for easy benchmarking and tracking of progress over time.
- Focus on ease of service: Unlike satisfaction scores, CES directly addresses the effort involved in interactions.
- Touchpoint or relationship level measurement: Provides flexibility in understanding customer effort across specific interactions or the entire customer relationship.
- Identifies friction points: Follow-up questions help pinpoint specific areas for improvement.
- Strong predictor of loyalty and repurchase behavior: Research shows a strong correlation between low effort and increased customer retention.
- More actionable than satisfaction scores alone: Provides specific areas to target for process improvement.
Pros and Cons:
- Pros: Strong predictor of customer loyalty, identifies friction points, actionable insights, prioritizes process improvements.
- Cons: Relatively newer metric with less historical benchmark data, may not capture emotional elements, requires careful survey timing, can be challenging to act on without additional context.
Examples of Successful Implementation:
- USAA leveraged CES feedback to redesign its claims process, resulting in a significant reduction in customer effort and increased satisfaction.
- Microsoft uses CES to streamline customer support pathways, making it easier for customers to get the help they need.
- Comcast improved their self-service options after identifying high effort scores related to accessing account information and making payments.
Actionable Tips:
- Time your surveys: Ask CES questions immediately following service interactions while the experience is fresh in the customer's mind.
- Prioritize high-impact areas: Focus improvement efforts on high-volume, high-effort touchpoints.
- Collaborative problem-solving: Create cross-functional teams to address complex effort issues.
- Map the customer journey: Identify and eliminate unnecessary steps in the customer experience.
- Combine with qualitative feedback: Pair CES data with qualitative feedback (e.g., open-ended survey responses) for a richer understanding of customer experiences.
Popularized By: The concept of CES was popularized by Matthew Dixon (co-author of The Effortless Experience), CEB (now Gartner), and research published in the Harvard Business Review. Their work highlighted the importance of reducing customer effort as a key driver of loyalty.
6. Employee Engagement/Satisfaction
In the realm of customer service performance indicators, employee engagement/satisfaction stands as a crucial, albeit indirect, measure of success. It gauges the commitment, motivation, and overall happiness of your customer service staff. This metric deserves its place on this list because of the undeniable link between a thriving workforce and exceptional customer experiences. Happy employees translate to happy customers, plain and simple.
How does it work? Employee engagement captures the pulse of your team by assessing how invested they are in their roles and the company as a whole. It delves into factors like job satisfaction, the sense of empowerment they feel, and how well their values align with the organization's. This is typically measured through regular employee surveys, often including the eNPS (Employee Net Promoter Score), a metric reflecting the likelihood of employees recommending the company as a place to work. These surveys can be segmented by team, tenure, or even individual managers to pinpoint specific areas for improvement.
The benefits of prioritizing employee engagement are manifold. It serves as a strong predictor of customer satisfaction and loyalty. Think about it: engaged employees are more likely to go the extra mile, handle difficult situations with grace, and build genuine rapport with customers. This, in turn, reduces costly employee turnover – a significant drain on resources and morale. Moreover, by monitoring employee sentiment, you can identify management and operational issues before they negatively impact customers. It's a proactive approach that fosters a positive feedback loop between employee and customer experience.
For example, Zappos, known for its exceptional customer service, built its reputation on a foundation of strong company culture and prioritizing employee happiness. Learn more about Employee Engagement/Satisfaction Similarly, Southwest Airlines' employee-first approach has consistently led to industry-leading customer satisfaction. Even in luxury settings, like The Ritz-Carlton, empowering employees with discretionary spending for guest satisfaction showcases the power of trust and investment in the workforce.
However, it's important to acknowledge the potential downsides. Employee engagement is an indirect measure of customer service performance. Results can be influenced by factors outside of the work environment, making it challenging to isolate specific causes. Addressing identified issues requires a long-term commitment, and if surveys are conducted too frequently, "survey fatigue" can set in, skewing results.
So, how can you effectively leverage employee engagement as a customer service performance indicator?
- Regular Pulse Surveys: Instead of relying solely on annual surveys, implement frequent, shorter "pulse" surveys to capture real-time feedback.
- Accountability: Hold managers accountable for their team's engagement scores. This fosters a sense of ownership and encourages proactive measures to improve the work environment.
- Feedback Systems: Implement employee feedback systems that mirror your customer feedback processes. This shows employees that their voices are valued.
- Connect the Dots: Demonstrate the direct connection between improvements in employee engagement and positive customer outcomes. This reinforces the importance of their contribution.
- Peer Recognition: Create peer recognition programs to celebrate and reinforce service excellence, fostering a culture of appreciation.
By focusing on employee engagement, businesses across various industries – from customer support centers and hospitality to healthcare, real estate, and enterprise IT – can create a workforce that is not only happier and more fulfilled but also better equipped to deliver exceptional customer experiences. This is a valuable tool for everyone from the business owner and CEO to the CTO and individual team managers. By understanding and addressing the needs of your employees, you pave the way for sustained customer loyalty and business growth.
7. Quality Assurance Score
Quality Assurance (QA) Score, a crucial customer service performance indicator, provides a measurable lens through which to view the effectiveness of your customer interactions. It's an internal metric that gauges how well your customer service representatives adhere to pre-defined quality standards during every interaction, be it a phone call, email, chat, or even social media engagement. This makes it a valuable tool for any business striving to deliver consistent and high-quality service, earning its place on this list of essential performance indicators.
Imagine having a clear picture of how your team handles customer inquiries, resolves issues, and represents your brand. That's the power of a well-implemented QA score. It works by systematically evaluating recorded calls, emails, or chat transcripts against a standardized scorecard. This scorecard acts as a blueprint for ideal customer interactions, covering critical areas like the accuracy and completeness of information provided, adherence to regulatory compliance requirements, the effective use of soft skills like empathy and active listening, and the agent's problem-solving abilities. These scores are typically expressed as a percentage of compliance with the established standards.
The benefits of tracking QA scores are multifold. Firstly, it offers an objective assessment of service quality, moving beyond anecdotal feedback and gut feelings. This objective data pinpoints specific training needs for individual agents, allowing you to invest in targeted coaching and professional development. For industries with strict regulatory obligations, such as healthcare or finance, QA scores help demonstrate compliance, mitigating potential risks. Finally, a robust QA program fosters consistency across your entire service team, ensuring every customer receives a similar level of care and professionalism, regardless of the agent they interact with.
However, implementing a QA program isn't without its challenges. It can be labor-intensive, requiring dedicated personnel to review interactions and provide feedback. If used punitively, it can create stress and anxiety amongst agents, potentially stifling their creativity and leading to robotic, scripted interactions if the evaluation criteria are too rigid. Furthermore, a focus solely on internal standards might inadvertently create a disconnect with the customer’s actual perception of quality.
Several successful companies demonstrate how to effectively leverage QA scoring. Amazon, for instance, utilizes QA scores to identify coaching opportunities for its vast network of contact center agents. American Express evaluates 3-5% of all customer interactions to ensure quality standards are consistently met. T-Mobile provides a great example of a customer-centric approach, developing a QA program that prioritizes effective problem resolution and customer satisfaction over strict script adherence.
To maximize the benefits and minimize the pitfalls of QA scoring, consider these actionable tips:
- Focus on Customer Outcomes: Integrate the customer’s outcome as a key component of your scoring rubric. Did the interaction resolve the customer's issue effectively? Were they satisfied with the resolution?
- Ensure Consistency: Implement calibration sessions between evaluators to ensure consistent application of the scoring criteria and avoid subjective biases.
- Find the Right Balance: Strike a balance between compliance elements (e.g., adherence to scripts, regulatory requirements) and customer experience elements (e.g., empathy, personalization).
- Involve Your Agents: Involving agents in the development of the QA program fosters buy-in and ensures the criteria are relevant and practical.
- Focus on Coaching: Use QA insights for targeted coaching and development rather than as a tool for punishment.
Organizations like COPC Inc. (Customer Operations Performance Center), ICMI (International Customer Management Institute), and Six Sigma methodology for service excellence have championed the importance of QA in achieving customer service excellence.
By understanding and effectively implementing a QA scoring system, businesses across diverse sectors – from customer support and hospitality to healthcare and IT – can gain valuable insights into their customer service performance, identify areas for improvement, and ultimately, deliver exceptional customer experiences that drive loyalty and growth.
8. Customer Lifetime Value (CLV)
Customer Lifetime Value (CLV) is a crucial customer service performance indicator that deserves a prominent place on any business's radar. It calculates the total revenue a business can reasonably expect from a single customer account throughout their entire relationship. Think of it as a prediction of a customer's total spending power with your company, from their first purchase to their last. Why is this so important for customer service? Because CLV directly connects the quality of your customer experience to long-term financial gains, demonstrating how investments in service translate to tangible business outcomes. For customer support managers, hospitality professionals, real estate agents, healthcare providers, enterprise IT managers, business owners, CEOs, and CTOs alike, understanding and leveraging CLV is paramount to sustainable growth.
CLV is a long-term financial metric, typically measured in currency value (e.g., dollars, euros), that quantifies the overall business value generated by a single customer. It considers factors like purchase frequency, average order value, and the projected lifespan of the customer relationship. The beauty of CLV lies in its ability to be segmented. You can analyze CLV by customer type (e.g., high-value vs. low-value), acquisition channel (e.g., social media vs. email marketing), or even by service experience (e.g., customers who had a positive interaction vs. those who had a negative one). This granular approach allows businesses to pinpoint the specific drivers of CLV and optimize their strategies accordingly.
The Power of CLV: Examples in Action
Several companies have successfully leveraged CLV to drive remarkable growth. Starbucks, for example, discovered that increasing customer retention by just 5% could boost CLV by a staggering 25-95%. This highlights the immense impact of fostering customer loyalty. Amazon Prime's exceptional service model, with its fast shipping and diverse benefits, dramatically increases member CLV compared to non-Prime members. Similarly, Apple’s Genius Bar support, known for its personalized and efficient problem-solving, contributes significantly to the company’s industry-leading CLV metrics. These examples illustrate how a strong focus on customer service can translate into substantial financial rewards.
Pros and Cons of Using CLV:
Pros:
- Provides strong financial justification for customer service investments.
- Helps prioritize service improvements with the highest return on investment (ROI).
- Directly connects service performance to tangible business outcomes.
- Encourages long-term, strategic thinking in customer service initiatives.
Cons:
- Can be complex to calculate accurately, requiring sophisticated models.
- Requires integrating data from multiple business systems (e.g., CRM, sales, marketing).
- Many factors beyond service quality (e.g., economic conditions, competitor actions) can affect CLV.
- Historical data may not always accurately predict future purchasing patterns.
Actionable Tips for Leveraging CLV:
- Segment your CLV: Analyze CLV by different customer segments based on their service experience (high satisfaction vs. low satisfaction) to identify areas for improvement.
- Track CLV changes after service improvements: Monitor how changes in your service strategy impact CLV to measure the effectiveness of your efforts.
- Use CLV to determine appropriate service levels: Allocate resources strategically by providing higher service levels to customer segments with higher CLV.
- Include referral value in CLV calculations: Factor in the potential revenue generated by customer referrals, as positive service experiences can lead to increased word-of-mouth marketing.
- Connect service recovery success to changes in predicted CLV: Analyze how effective service recovery impacts predicted CLV for customers who have had negative experiences.
Learn more about Customer Lifetime Value (CLV)
When and Why to Use CLV:
CLV should be a core component of any business strategy focused on long-term growth and profitability. It's particularly valuable for businesses with recurring revenue models or those seeking to build strong customer relationships. By understanding CLV, organizations can make informed decisions about resource allocation, service improvements, and customer retention strategies. This metric, popularized by figures like Peter Fader (Wharton professor specializing in CLV), Harvard Business Review research on the service-profit chain, and Salesforce (with their CLV-focused CRM strategies), has become a cornerstone of modern customer service management. By incorporating CLV into your performance indicators, you gain a powerful tool for driving customer loyalty and achieving sustainable business success.
8 Key Customer Service Metrics Comparison
| Performance Indicator | Implementation Complexity 🔄 | Resource Requirements ⚡ | Expected Outcomes 📊 | Ideal Use Cases 💡 | Key Advantages ⭐ |
|---|---|---|---|---|---|
| Customer Satisfaction Score (CSAT) | Low - simple surveys after interactions | Low - easy deployment of short surveys | Immediate feedback on specific interactions | Measuring satisfaction post-interaction in support | Easy to implement, actionable, compares channels |
| Net Promoter Score (NPS) | Low - single-question survey | Low - simple surveys, benchmarking | Indicator of customer loyalty and growth potential | Loyalty measurement, competitive benchmarking | Strong predictor of growth, easy benchmarking |
| First Contact Resolution (FCR) | Medium - requires tracking system & definitions | Medium - systems & training required | Improved efficiency, cost reduction, higher satisfaction | Operational efficiency, contact center performance | Directly linked to satisfaction, reduces repeat contacts |
| Average Resolution Time (ART) | High - end-to-end tracking across systems | High - extensive tracking & analytics | Identifies bottlenecks, enhances service speed | Complex issue resolution analysis | Holistic view, helps set realistic expectations |
| Customer Effort Score (CES) | Low to Medium - survey timing is critical | Low - targeted survey deployment | Identifies friction points and predicts loyalty | Reducing customer effort to improve retention | Actionable, strong loyalty predictor |
| Employee Engagement/Satisfaction | Medium - requires regular surveys and follow-up | Medium - ongoing survey and program maintenance | Links employee motivation to customer service quality | Improving employee and customer experience alignment | Predicts customer satisfaction, reduces turnover |
| Quality Assurance Score | High - labor-intensive evaluations | High - evaluator time and training | Ensures compliance, consistency, and training needs | Internal quality control and training programs | Objective quality assessment, identifies coaching needs |
| Customer Lifetime Value (CLV) | High - requires complex data integration | High - cross-department data and analysis | Financial impact of service, ROI justification | Strategic customer segmentation and investment | Connects service to revenue, prioritizes investments |
Elevating Your Customer Service Strategy with Data-Driven Insights
From understanding customer satisfaction (CSAT) and loyalty (NPS) to optimizing efficiency with metrics like First Contact Resolution (FCR) and Average Resolution Time (ART), the customer service performance indicators we've explored provide a powerful toolkit for enhancing the customer experience. By focusing on reducing customer effort (CES), ensuring high-quality interactions, and fostering employee engagement, you can create a positive feedback loop that drives significant improvements in Customer Lifetime Value (CLV). These metrics don't just offer a snapshot of your current performance—they provide a roadmap for future success. To effectively elevate your customer service strategy, it's essential to track and analyze key performance indicators. For a comprehensive guide on essential customer service performance metrics, check out this resource: 10 Customer Service Performance Metrics You Should Be Tracking from Call Criteria.
Mastering these customer service performance indicators empowers you to make data-driven decisions that ripple throughout your organization, impacting everything from customer retention and revenue growth to brand reputation and employee morale. In today's competitive landscape, understanding and acting upon these insights is no longer a differentiator—it's the price of entry. By embracing a data-centric approach, you're not just improving customer service, you're building a foundation for sustainable growth and lasting success.
Ready to transform your customer service operations and unlock the full potential of these key performance indicators? Explore how Voicetta, with its AI-powered capabilities, can streamline your workflows, boost efficiency metrics like FCR and ART, and ultimately enhance customer satisfaction and loyalty, driving positive impact on your crucial customer service performance indicators. Discover how Voicetta can help you build stronger customer relationships and achieve your business goals.