Unlocking Customer Support Excellence with KPIs
Want to deliver outstanding customer support and boost your bottom line? This listicle reveals eight essential customer support KPIs you need to track in 2025. Learn how metrics like First Response Time (FRT), Customer Satisfaction Score (CSAT), and Net Promoter Score (NPS) can pinpoint areas for improvement and optimize your support strategy. By understanding these customer support KPIs, you can create a customer-centric culture and drive business growth. Let's get started!
1. First Response Time (FRT)
In the fast-paced world of customer support, where instant gratification reigns supreme, First Response Time (FRT) stands as a critical KPI. It measures the average time it takes for a customer to receive an initial response from your support team after submitting a request. This metric isn't just about speed; it's about setting the tone for the entire customer interaction. A prompt response acknowledges the customer's issue, assures them they've been heard, and sets the expectation for a swift resolution. This makes FRT a cornerstone of any successful customer support strategy, and its significance in shaping customer perception and satisfaction cannot be overstated. It directly impacts how customers perceive your responsiveness and commitment to their needs.

FRT is calculated by measuring the time elapsed between the creation of a support ticket (or initial contact) and the first agent's response. This excludes automated responses like confirmation emails or chatbot greetings, as these don't represent actual engagement from a human agent. The measurement can be segmented by different communication channels – email, chat, phone, social media – providing valuable insights into channel-specific performance. While some industries might measure FRT in hours, others, particularly those leveraging live chat or phone support, often strive for responses within minutes, even seconds. These targets are often defined in Service Level Agreements (SLAs), which formalize your commitment to specific response times.
Consider the different approaches of various industry leaders. Zendesk reports an average email FRT of 12-24 hours across industries, highlighting the variability based on industry context and customer expectations. However, for a company like Amazon, where customer experience is paramount, the target for chat support is often sub-60 seconds. Salesforce, with its tiered support system, maintains different FRT targets depending on the customer's subscription level – perhaps 1 hour for premium support and 24 hours for standard support. These examples illustrate how FRT targets can be tailored to specific business models and customer segments.
Why is FRT so important? For starters, it directly influences customer satisfaction. A quick response demonstrates that you value their time and are actively working on their issue. It also allows you to manage customer expectations effectively. Furthermore, tracking FRT helps identify staffing needs and peak demand periods, allowing for more efficient resource allocation. Real-time monitoring of FRT can be automated through various helpdesk software solutions, allowing for proactive adjustments and ensuring consistent adherence to service level agreements.
However, FRT isn’t without its drawbacks. Focusing solely on speed can inadvertently encourage rushed, incomplete initial responses, potentially hindering the overall resolution process. Complex tickets that require extensive research or involve multiple departments might unfairly skew FRT results. Additionally, FRT doesn't measure the quality of the first response, only its speed. A quick but unhelpful response can be just as frustrating for a customer.
Here are some actionable tips to effectively leverage FRT in your customer support strategy:
- Set Realistic Targets: Don't aim for unrealistic FRT targets that strain your team. Consider your industry, resources, and the complexity of your product or service.
- Automate Acknowledgements: For complex issues, use automated acknowledgment messages to inform the customer that their request has been received and is being processed. This manages expectations and buys your team valuable time.
- Segment by Priority and Complexity: Segment FRT data by priority level and ticket complexity for a more nuanced understanding of performance. This allows for targeted improvements and more accurate benchmarking.
- Monitor Trends: Regularly monitor FRT trends to proactively identify potential staffing gaps, training needs, or emerging issues that impact response times.
- Empower Your Team: Equip your support team with the knowledge, tools, and resources they need to provide prompt and effective initial responses.
By understanding the nuances of FRT, its benefits, and its potential pitfalls, and by implementing the practical tips outlined above, businesses across various industries – from hospitality and real estate to healthcare and enterprise IT – can leverage this crucial KPI to significantly improve customer satisfaction and drive business success. By focusing on FRT, businesses can create a customer support experience that is not only efficient but also builds trust and loyalty. This, in turn, can lead to increased customer retention, positive word-of-mouth referrals, and ultimately, a stronger bottom line.
2. Customer Satisfaction Score (CSAT)
Customer Satisfaction Score (CSAT) is a key performance indicator (KPI) in customer support that measures how satisfied customers are with a specific interaction, like a support ticket resolution, or with their overall service experience. It provides a direct line to understanding how your customers perceive the quality of your support, giving you valuable insights to improve and refine your processes. CSAT is typically measured through post-interaction surveys asking customers to rate their experience on a numerical scale, commonly 1-5 or 1-10, where 1 represents extreme dissatisfaction and 5 or 10 represents extreme satisfaction. This straightforward approach allows for quick feedback collection and analysis. Its simplicity and direct correlation to customer happiness makes it a vital metric for any business striving to provide exceptional customer service.

One of the most significant advantages of CSAT is its flexibility. It can be collected through various channels, including email, SMS, in-app notifications, or even over the phone. Many customer support platforms allow for automated survey distribution immediately following a ticket resolution, ensuring timely feedback while the experience is still fresh in the customer's mind. This automation streamlines the process and reduces the manual effort required for data collection. CSAT surveys can also be tailored to measure satisfaction with specific interactions, such as a single support ticket resolution, or gauge overall satisfaction with the entire service experience, giving businesses a holistic view of customer sentiment.
Several successful companies leverage CSAT effectively to improve customer support. Apple, known for its exceptional customer service, consistently maintains high CSAT scores, often exceeding 90%, for its Genius Bar support. This focus on customer satisfaction contributes to their brand loyalty and positive reputation. Zappos, another customer-centric company, uses CSAT feedback to identify top-performing agents and pinpoint coaching opportunities, fostering a culture of continuous improvement within their support teams. Microsoft also utilizes CSAT, measuring it across different product lines to identify specific service gaps and prioritize areas for enhancement. These examples highlight the versatility and power of CSAT as a customer support KPI.
While CSAT is a valuable tool, it does have some limitations. Response rates can be a challenge, typically ranging from 10-30%, which can sometimes skew the data. Additionally, surveys may be biased toward extremely positive or negative experiences, as customers with neutral feelings are less likely to respond. Cultural differences can also influence rating patterns, requiring careful consideration when interpreting results across different regions. Finally, while CSAT provides a general indication of satisfaction, it doesn't always offer detailed feedback on specific areas for improvement. Further investigation may be needed to understand the underlying reasons behind customer ratings.
Despite these limitations, CSAT remains a crucial metric. To maximize its effectiveness and mitigate potential downsides, consider these tips: Keep surveys short and concise (1-3 questions) to improve response rates; ask for ratings immediately after issue resolution to capture accurate feedback; follow up on low scores with additional questions to delve deeper into the customer's concerns and identify areas for improvement; and use CSAT data proactively to identify training needs for your support agents and implement process improvements to enhance the overall customer experience. Learn more about Customer Satisfaction Score (CSAT) and how it can benefit your organization.
By effectively implementing CSAT and acting upon the gathered insights, businesses across various industries—from hospitality and real estate to healthcare and enterprise IT—can significantly improve their customer support, build stronger customer relationships, and ultimately drive growth. Whether you are a customer support manager, a business owner, a CEO, or a CTO, understanding and utilizing CSAT is essential for creating a customer-centric culture and achieving long-term success. Using CSAT in conjunction with other customer support KPIs allows for a more comprehensive understanding of the customer journey and provides actionable insights for enhancing the overall customer experience.
3. First Contact Resolution (FCR)
In the fast-paced world of customer support, efficiency and customer satisfaction are paramount. One of the most critical customer support KPIs that directly impacts both these areas is First Contact Resolution (FCR). This metric measures the percentage of customer issues that are completely resolved during the initial interaction, eliminating the need for any follow-up contacts. A high FCR rate translates to happier customers, lower support costs, and a more streamlined operation. It’s a vital indicator of how effectively your support team addresses customer needs at the first point of contact.
FCR can be measured across all support channels, including phone calls, emails, live chat sessions, and even self-service portals. However, effectively tracking this KPI requires a clear and consistent definition of what constitutes a "resolved" issue versus one requiring a follow-up. Imagine a customer calling with a complex technical problem. Simply closing the ticket after providing initial troubleshooting steps, even if the issue persists, doesn't count as true resolution. True FCR means the customer's problem is completely solved in that first interaction. This often necessitates tracking related metrics like repeat contact rate to gain a holistic understanding of resolution effectiveness.
Why does FCR deserve its place on the list of essential customer support KPIs? Quite simply, it's a win-win metric. For customers, it minimizes the effort required to get their issues resolved, leading to greater satisfaction and loyalty. From a business perspective, FCR reduces operational costs by minimizing the resources spent on handling repeat contacts. It also reflects positively on agent knowledge, process effectiveness, and the overall customer experience.
Implementing FCR effectively hinges on several key features. Accurate percentage calculation requires meticulous tracking of every customer interaction and its outcome. This data must then be analyzed across all channels to identify potential weaknesses in specific areas. Perhaps your live chat support boasts high FCR, while email support lags behind. This insight allows you to focus improvement efforts where they are most needed. Finally, aligning the definition of "resolution" across the organization ensures consistent measurement and meaningful results.
Of course, no KPI is without its potential drawbacks. One concern is that a hyper-focus on FCR can inadvertently encourage agents to prematurely close tickets without truly resolving the underlying issue. It's a delicate balance between efficiency and thoroughness. Another challenge lies in the complexity of accurately measuring FCR across diverse channels with varying interaction styles. What constitutes resolution on a quick chat might differ from a lengthy phone call. Furthermore, complex issues often necessitate multiple touchpoints, making a single-contact resolution impossible. In such scenarios, FCR might not be the most appropriate metric for evaluating performance. Finally, differing interpretations of "resolution" across organizations can make benchmarking and comparisons challenging.
Several companies have demonstrated successful FCR implementation. American Express, renowned for its exceptional customer service, achieves FCR rates of 85% or higher through extensive agent training and empowerment. T-Mobile improved its FCR from 68% to 75% by implementing improved knowledge management systems, giving agents quicker access to the information they need to resolve issues efficiently. Southwest Airlines maintains high FCR rates by empowering agents to make decisions without requiring escalation, streamlining the resolution process.
For businesses seeking to enhance their customer support performance, focusing on FCR offers significant advantages. Here are some actionable tips to improve your FCR rates:
- Invest in comprehensive agent training and readily accessible knowledge bases: Equip your team with the skills and resources to handle a wide array of customer issues effectively.
- Empower agents with decision-making authority: Allow agents to resolve issues without unnecessary escalations, speeding up the resolution process and empowering employees.
- Use call-back surveys to verify actual resolution: Don’t just assume an issue is resolved. Follow up with customers to confirm their satisfaction and identify any lingering problems.
- Analyze repeat contacts to identify common failure points: Use data to pinpoint areas where FCR consistently falls short and address the root causes.
By understanding the nuances of FCR, its benefits, potential pitfalls, and best practices for implementation, businesses across various sectors – from hospitality and real estate to healthcare and IT – can leverage this KPI to elevate customer satisfaction, streamline operations, and drive bottom-line results. Whether you're a customer support manager, a business owner, or a CEO, prioritizing FCR is a strategic move that can significantly impact your overall success.
4. Average Resolution Time (ART)
Average Resolution Time (ART) is a crucial customer support KPI that measures the average time it takes to resolve a customer issue, from the moment it's reported to the moment it's fully resolved. For anyone managing a customer support team – whether you're a Customer Support Manager in a tech company, a Hospitality Professional dealing with guest requests, a Real Estate Agent navigating closing processes, a Healthcare Provider addressing patient concerns, an Enterprise IT Manager tackling system outages, or a business owner wearing multiple hats – understanding and optimizing ART is essential for providing efficient service and building customer loyalty. It deserves its place on this list because it directly reflects the effectiveness of your support processes and their impact on the customer experience.
ART calculates the total time elapsed between the creation of a support ticket (or initial customer contact) and its final resolution. This includes all interactions, agent work time, and any internal processes required to address the issue. It's often measured in hours or days, depending on the complexity of your services. For instance, a simple password reset might be resolved within minutes, while a complex technical integration issue could take several days.
Understanding how ART works is crucial for leveraging its potential. Imagine a customer reporting a faulty product. The clock starts ticking the moment the complaint is registered, perhaps via email, phone, or a support ticket system. It continues running through all subsequent interactions, including troubleshooting steps, internal escalations, and communication with the customer. The timer stops only when the issue is resolved to the customer's satisfaction and the ticket is closed.
Successful implementation of ART tracking and improvement relies on a data-driven approach. Consider these real-world examples: HubSpot, a leading CRM platform, segments ART by ticket priority. They might find that P1 (critical) issues average 4 hours to resolution, while P3 (lower priority) issues average 3 days. This allows them to allocate resources effectively and set appropriate expectations. Similarly, Shopify might have reduced their average resolution time by 40% by implementing improved internal tools and processes, leading to faster issue resolution and happier customers. Atlassian, known for its project management software, might use ART data to optimize their support team structure and specialization, ensuring the right expertise is readily available for different issue types.
Here's how you can leverage ART to improve your own support processes:
- Segment ART by Issue Complexity and Priority Levels: Grouping similar issues allows you to identify trends and pinpoint areas for improvement. Don't expect the same ART for a simple question as for a complex technical problem.
- Exclude Time Waiting for Customer Response from Calculations: This ensures you’re measuring your team's efficiency, not customer responsiveness. Many ticketing systems allow for this automated adjustment.
- Use ART Trends to Identify Process Improvement Opportunities: Is ART steadily increasing? This might indicate bottlenecks in your workflow, insufficient training, or inadequate resources.
- Set Different ART Targets for Different Types of Issues: A one-size-fits-all target can be misleading. Tailor your targets to the specific nature of the problem.
- Regularly Review and Adjust Your Approach: The customer support landscape is constantly evolving. Stay flexible and adapt your strategies based on data and feedback.
While ART offers valuable insights, it’s important to be aware of its potential drawbacks:
- Premature Ticket Closure: Agents might be tempted to close tickets prematurely to artificially improve the metric. Implement quality assurance measures to prevent this.
- Influence of Complexity and Priority: ART can be heavily influenced by factors outside the support team’s control. Acknowledge these limitations when interpreting the data.
- Customer-Perceived Resolution Time: ART doesn’t always reflect the customer's experience. A customer might feel an issue dragged on even if the measured ART is within acceptable limits. Gather customer feedback to understand their perception.
- External Dependencies: Resolving some issues might depend on external factors (third-party vendors, shipping delays, etc.), which can impact ART.
By understanding the nuances of ART, its benefits, and potential pitfalls, and by implementing the tips provided, you can use this crucial customer support KPI to optimize your support processes, improve efficiency, and ultimately, enhance the customer experience. This translates to increased customer satisfaction, loyalty, and a healthier bottom line – benefits that any manager, in any industry, can appreciate.
5. Net Promoter Score (NPS)
Net Promoter Score (NPS) is a crucial customer support KPI that gauges customer loyalty and their likelihood to recommend your services. It’s a powerful metric for understanding customer satisfaction and predicting business growth, earning it a well-deserved spot on this list. Unlike complicated customer satisfaction surveys, NPS relies on a single, straightforward question: "On a scale of 0 to 10, how likely are you to recommend our company/service to a friend or colleague?" This simplicity makes it easy for customers to respond and provides a clear, quantifiable measure of customer sentiment.
This seemingly simple question unlocks a wealth of insights. Based on their responses, customers are categorized into three groups: Detractors (0-6), Passives (7-8), and Promoters (9-10). Detractors are dissatisfied and may even discourage others from using your services. Passives are satisfied but not enthusiastic, leaving them vulnerable to competitors. Promoters, on the other hand, are your loyal advocates, actively recommending your services and driving new business.
The NPS itself is calculated by subtracting the percentage of Detractors from the percentage of Promoters. This results in a score ranging from -100 to +100. A higher score indicates a stronger customer base and a greater likelihood of growth through positive word-of-mouth. The beauty of NPS lies in its ability to be measured for specific interactions (e.g., after a support call) or for the overall customer relationship, offering granular and holistic perspectives on customer experience.
Companies across diverse industries successfully leverage NPS to improve their customer support. Apple, renowned for its customer service, consistently maintains NPS scores above 70. Zappos uses NPS feedback to identify opportunities for service excellence and personalize customer interactions. Netflix tracks support NPS separately from product NPS, allowing them to isolate and measure the specific impact of their customer service efforts.
So, when and why should you use NPS? It's a valuable tool for any business that prioritizes customer retention and growth. It's particularly useful for tracking the impact of customer support initiatives, identifying areas for improvement, and benchmarking against competitors.
Pros of using NPS:
- Strong predictor of customer retention and business growth: A high NPS often correlates with increased customer lifetime value and revenue growth.
- Simple for customers to understand and complete: The single-question format maximizes response rates.
- Enables benchmarking against competitors and industry standards: Understand how your customer loyalty stacks up against others.
- Correlates with word-of-mouth marketing impact: Promoters are more likely to recommend your services, driving organic growth.
Cons of using NPS:
- Cultural differences can significantly impact scoring patterns: Response biases may exist across different cultural contexts.
- Doesn't provide specific feedback on improvement areas: While it highlights overall sentiment, it doesn't pinpoint specific issues.
- Can be influenced by factors outside of support quality: External factors like product issues can affect responses.
- May not be suitable for all business models or customer types: Niche businesses with limited customer interaction may find it less effective.
Tips for effectively using NPS:
- Follow up NPS surveys with open-ended questions for context: Gain deeper insights into the reasons behind the scores.
- Track NPS trends over time rather than focusing on single scores: Observe patterns and identify long-term improvements.
- Segment NPS by customer type, issue category, or support channel: Pinpoint specific areas of strength and weakness.
- Use Promoter feedback to identify and replicate best practices: Learn from your most enthusiastic customers.
The following infographic visualizes a typical NPS distribution, showcasing the proportion of Promoters, Passives, and Detractors.
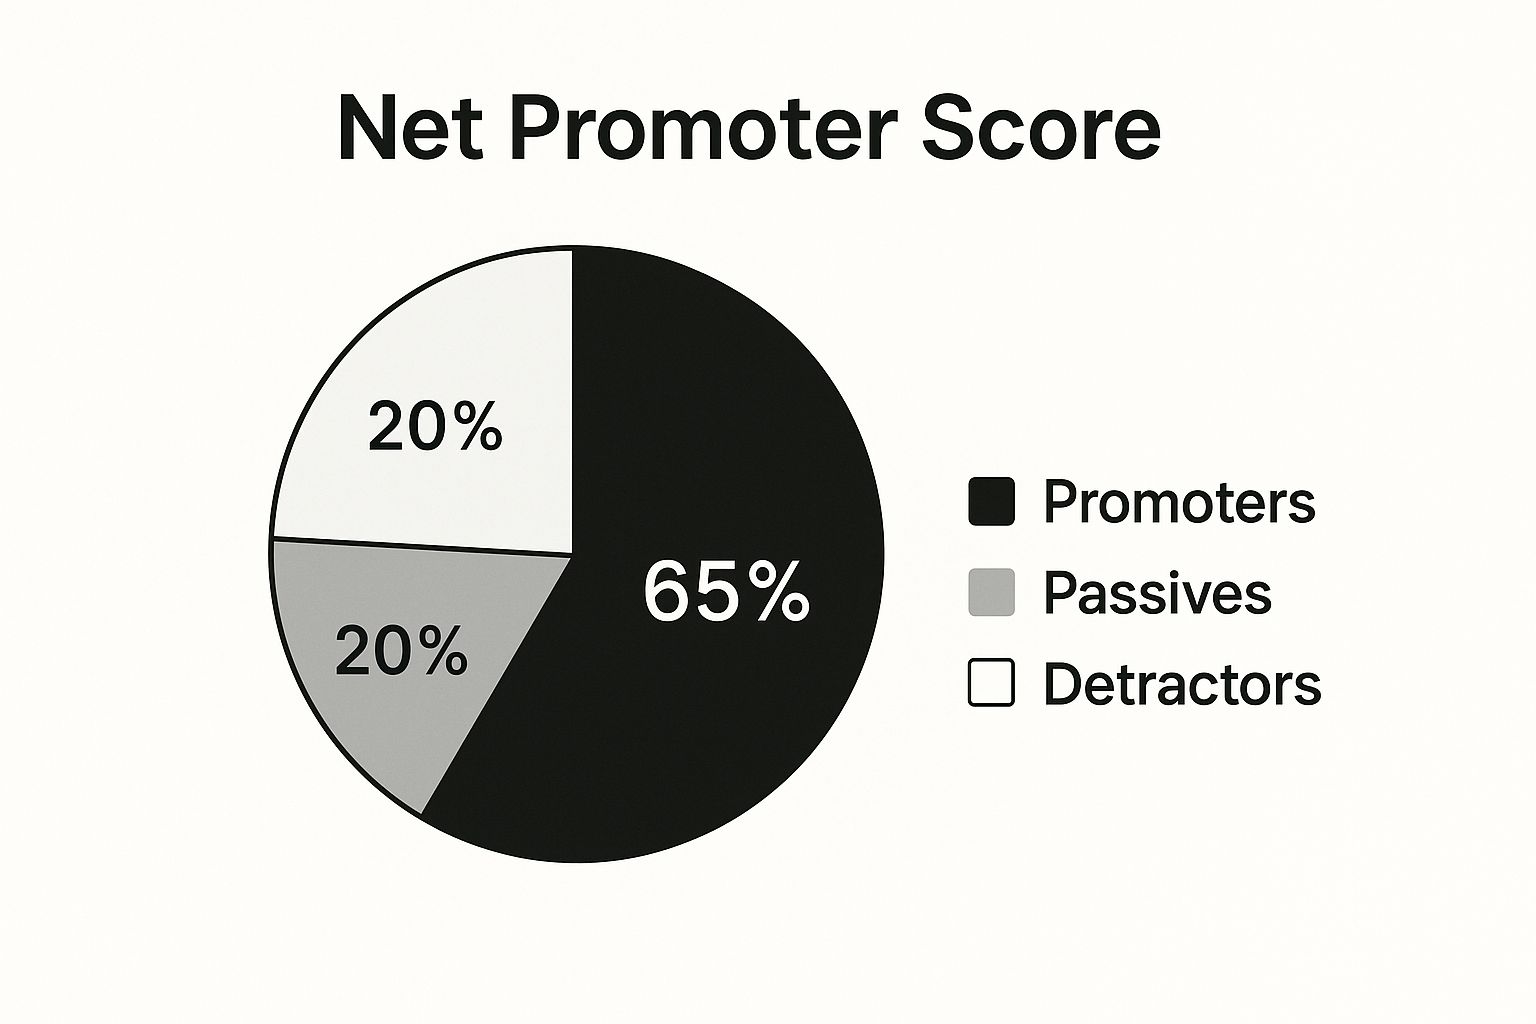
This pie chart clearly shows that Promoters make up the majority (65%) of respondents, followed by Passives (20%) and Detractors (15%). This positive distribution suggests a strong customer base and a healthy level of customer loyalty. By continually monitoring and improving your NPS, you can foster a loyal customer base, drive positive word-of-mouth marketing, and ultimately fuel sustainable business growth. NPS, while a simple metric, offers a powerful lens for understanding customer sentiment and building a customer-centric organization. Popularized by Fred Reichheld of Bain & Company and Satmetrix, it has become a cornerstone of customer experience management.
6. Ticket Volume and Trends
Ticket volume and trends are critical customer support KPIs that provide invaluable insights into the health and efficiency of your support operations. This metric measures the total number of support requests received over a specific time period, while trend analysis examines patterns in these volume changes. Understanding these patterns helps businesses optimize resource allocation, proactively address emerging issues, and ultimately enhance the customer experience. This KPI deserves a prominent place in any customer support manager's toolkit because it offers a direct line of sight into the demands placed on the support team and the overall satisfaction of the customer base. Whether you're a hospitality professional dealing with guest inquiries, a real estate agent managing client requests, a healthcare provider addressing patient concerns, an Enterprise IT manager troubleshooting technical issues, or a business owner wearing multiple hats, understanding your ticket volume is crucial for success.
So, how does it work? Imagine your support team as a bustling emergency room. Ticket volume represents the number of patients coming through the doors. A sudden influx could signal a widespread issue, like a new software bug or a confusing marketing campaign. Conversely, a steady decline might suggest improved product documentation or a more intuitive user interface. Trend analysis helps you diagnose the "cause" of these fluctuations, acting as your epidemiological study. Are tickets peaking during specific hours? Are certain customer segments submitting more requests than others? These are the questions trend analysis helps you answer.
Tracking ticket volume is more than just counting tickets; it's about understanding the story behind the numbers. This KPI can be segmented by various factors like support channel (email, phone, chat), issue type (technical, billing, product information), or customer segment (new users, enterprise clients). This granular view allows for more targeted interventions. For example, a surge in "how-to" tickets related to a specific feature might indicate the need for improved user onboarding. This segmentation is crucial for pinpointing problem areas and optimizing your support strategies. Features like automated reporting and dashboards make this tracking and segmentation process more efficient, providing real-time visibility into your support operations.
Many successful organizations leverage ticket volume and trend analysis to improve their customer support. Spotify, for example, closely monitors ticket volume spikes during new feature releases to proactively plan support capacity and ensure a smooth user experience. Uber analyzes ticket volume patterns to identify peak support periods, allowing them to adjust staffing levels and minimize wait times. Dropbox uses volume trends to identify and address common user issues proactively, even before they escalate into widespread problems. These examples showcase how analyzing ticket volume and trends can lead to data-driven decisions that positively impact both customer satisfaction and operational efficiency.
Want to harness the power of ticket volume and trends for your own business? Here are some actionable tips:
- Analyze volume trends alongside product releases and marketing campaigns: A new product launch or a promotional campaign can significantly impact support volume. By anticipating these fluctuations, you can preemptively allocate resources and avoid being caught off guard.
- Segment ticket volume by issue type to identify problem areas: Don't just look at the total number of tickets; delve deeper into the specific issues driving those requests. This helps you identify recurring problems and prioritize solutions.
- Use historical data to predict and prepare for seasonal variations: Many businesses experience predictable fluctuations in support volume throughout the year. Historical data allows you to anticipate these trends and proactively adjust staffing and resources.
- Correlate volume changes with customer satisfaction metrics: A sudden increase in ticket volume coupled with a drop in customer satisfaction scores could indicate a serious underlying issue that requires immediate attention.
While ticket volume and trends are powerful indicators of support performance, they also have some limitations. A high volume doesn't necessarily indicate poor service. It could be a result of a growing customer base, increased product awareness, or even a successful marketing campaign that drives more inquiries. External factors, such as industry trends or competitor actions, can also influence ticket volume. Therefore, it’s crucial to analyze ticket volume in context and consider other relevant metrics. For instance, a spike in tickets following a new product launch might be expected and not necessarily a cause for concern. Initiatives that aim to improve customer self-service, such as robust knowledge bases or interactive tutorials, might initially lead to an increase in support tickets as customers become more aware of the available resources. This temporary increase shouldn’t discourage such initiatives, as they ultimately lead to long-term reductions in support volume.
Learn more about Ticket Volume and Trends to delve into advanced strategies for analyzing customer interactions and optimizing your support performance. By understanding and effectively utilizing ticket volume and trend analysis as a customer support KPI, you can gain invaluable insights into your customer needs, improve operational efficiency, and ultimately deliver a superior customer experience. This, in turn, contributes to increased customer loyalty and business growth.
7. Agent Utilization Rate
Agent Utilization Rate is a crucial customer support KPI that measures the percentage of an agent's working time actively dedicated to customer-facing activities, as opposed to idle time or administrative tasks. It provides valuable insights into how effectively your team is using their time and helps you optimize staffing, improve efficiency, and ultimately, deliver a better customer experience. For customer support managers, hospitality professionals, real estate agents, healthcare providers, enterprise IT managers, business owners, CEOs, and CTOs alike, understanding and effectively leveraging this metric can be a game-changer.
In essence, Agent Utilization Rate paints a picture of how busy your support team is. It encompasses the time spent on various support channels like handling tickets, answering calls, responding to chats, and engaging in other related tasks. By tracking utilization across these different activities and channels, you gain a granular view of where your agents are spending their time and can identify potential bottlenecks or areas for improvement. This granular data is invaluable for making informed decisions about staffing levels, scheduling, and resource allocation.
Think of it this way: if your agents are constantly overwhelmed and their utilization rate is consistently above 90%, it's a clear sign that they're stretched too thin. This can lead to burnout, decreased service quality, and ultimately, dissatisfied customers. Conversely, a very low utilization rate suggests that agents are spending too much time idle and resources are not being used efficiently. Ideally, agent utilization should be maintained within a specific range, typically between 70-85%, to balance productivity with agent well-being and service quality.
Several industry leaders have demonstrated the importance of monitoring and optimizing Agent Utilization Rate. For example, Zendesk, a prominent customer service software provider, recommends maintaining agent utilization between 70-80% for optimal performance. They've found that this sweet spot allows agents to handle a healthy workload without feeling overwhelmed, leading to better customer interactions and increased job satisfaction. Similarly, LivePerson, a leading conversational commerce platform, discovered that utilization rates exceeding 85% often resulted in decreased customer satisfaction. This highlights the delicate balance between keeping agents busy and ensuring they have enough time to provide quality support. Genesys, another key player in the customer experience management space, leverages utilization data to optimize workforce management and scheduling, ensuring that the right number of agents are available at the right times to handle fluctuating customer demand.
There are several compelling reasons why Agent Utilization Rate deserves its place amongst the top customer support KPIs. It helps optimize staffing levels and schedules by providing data-driven insights into workload distribution and peak demand periods. By identifying periods of low and high utilization, you can adjust staffing accordingly, minimizing overstaffing during slower periods and ensuring adequate coverage during peak times. Furthermore, it can reveal opportunities for process improvement. For instance, if agents are spending a significant amount of time on repetitive tasks, it might indicate a need for automation or improved workflows.
However, while Agent Utilization Rate is a valuable metric, it’s important to be aware of its limitations. A high utilization rate, while seemingly indicative of productivity, can lead to agent burnout and a decline in service quality if not managed carefully. It’s also crucial to remember that this metric doesn't account for the complexity or quality of work performed. Two agents might have the same utilization rate, but one might be handling significantly more complex issues than the other. Focusing solely on utilization can inadvertently encourage quantity over quality in support interactions, ultimately impacting customer satisfaction. Finally, constantly pushing for high utilization can create pressure that negatively impacts agent job satisfaction and morale.
To effectively leverage Agent Utilization Rate, consider these practical tips: Balance utilization targets with quality and satisfaction metrics. Don’t just focus on keeping agents busy; ensure they’re providing excellent service. Account for training, breaks, and administrative time in your calculations to get a realistic picture of agent availability. Use utilization data to identify coaching and development needs. If an agent’s utilization is consistently low, it might signal a need for additional training or support. And finally, monitor utilization trends over time to prevent agent burnout and proactively address potential issues. Learn more about Agent Utilization Rate By understanding and effectively utilizing Agent Utilization Rate, you can create a more efficient and productive support team while simultaneously improving the customer experience.
8. Customer Effort Score (CES)
In the realm of customer support KPIs, Customer Effort Score (CES) stands out as a powerful metric focusing on the ease of interaction for your customers. Unlike traditional satisfaction surveys, CES delves into the practicalities of the support experience, measuring how much effort a customer had to expend to get their issue resolved or achieve their desired outcome. This makes CES a valuable tool for businesses across various sectors, from hospitality and real estate to healthcare and enterprise IT. For customer support managers, CEOs, CTOs, and business owners alike, understanding and leveraging CES can significantly impact customer loyalty and, ultimately, the bottom line.
CES typically operates on a scale of 1-7, ranging from "very difficult" to "very easy." Customers are asked a simple question after an interaction, such as "How much effort did you personally have to put forth to handle your request?" This direct approach allows businesses to gauge the friction points within their support processes. Are customers struggling to navigate the website? Is the phone menu confusing? Are agents equipped to handle queries efficiently? CES provides the insights necessary to answer these crucial questions.
The focus on effort, rather than just satisfaction, is what makes CES a particularly effective customer support KPI. While satisfaction is important, it doesn't always correlate with loyalty. A customer might be satisfied with a resolution, but if the process to get there was convoluted and time-consuming, they're less likely to return. CES directly addresses this by identifying and quantifying these pain points, making it a stronger predictor of customer loyalty and retention.
One of the key benefits of using CES is its ability to pinpoint specific areas for improvement. For instance, if customers consistently report high effort when using the self-service portal, you know exactly where to focus your optimization efforts. This targeted approach allows you to prioritize process improvement initiatives, leading to more efficient and effective support operations. Moreover, CES correlates with repeat purchase behavior and customer lifetime value. By reducing customer effort, you're not just improving their immediate experience but also fostering long-term relationships and increasing their overall value to your business.
Several companies have demonstrated the power of CES in practice. Google, for example, uses CES to continuously optimize its support portal and self-service options, ensuring users can easily find the answers they need. American Express found that reducing customer effort had a greater impact on customer loyalty than exceeding their expectations. And Siebel (now part of Oracle) implemented CES to identify and eliminate process complexity, streamlining their support operations and improving customer satisfaction.
While CES offers numerous advantages, it's important to be aware of its limitations. As a relatively new metric, there’s less historical benchmarking data available compared to more established KPIs. Additionally, customer expectations and context can influence CES scores. For example, a customer accustomed to complex support processes might rate a relatively straightforward interaction as easier than someone with different expectations. Finally, CES may not fully capture the emotional aspects of the customer experience.
To maximize the effectiveness of CES, consider the following tips:
- Timely Surveys: Ask CES questions immediately after the interaction is completed, while the experience is still fresh in the customer's mind.
- Actionable Insights: Focus on process improvements that directly reduce customer effort. Don't just collect data; use it to drive change.
- Qualitative Feedback: Combine CES with qualitative feedback to understand the underlying reasons behind high-effort scores. Asking open-ended questions can provide valuable context.
- Self-Service Evaluation: Use CES to evaluate the effectiveness of your self-service options and automation tools. Are these resources truly making things easier for customers, or are they creating new points of friction?
The concept of CES was popularized by the Corporate Executive Board (CEB), now part of Gartner, and researchers like Matthew Dixon and his colleagues. Their work highlighted the strong correlation between customer effort and loyalty, paving the way for widespread adoption of CES as a key customer support KPI. By incorporating CES into your customer support strategy, you can gain invaluable insights into the customer journey, identify areas for improvement, and ultimately create a more seamless and effortless experience that fosters loyalty and drives business growth.
Customer Support KPI Comparison
| KPI | Implementation Complexity 🔄 | Resource Requirements 💡 | Expected Outcomes 📊 | Ideal Use Cases 💡 | Key Advantages ⭐ |
|---|---|---|---|---|---|
| First Response Time (FRT) | Moderate; requires channel segmentation and real-time tracking | Moderate; staffing for timely responses and automation tools | Faster initial customer engagement, improved satisfaction | Fast-paced support channels (chat, phone, email) | Direct impact on perceived responsiveness; easy to benchmark |
| Customer Satisfaction Score (CSAT) | Low; simple survey deployment post-interaction | Low to Moderate; survey tools and data analysis | Direct customer feedback on support quality | Measuring specific interaction satisfaction | Clear insight into service quality; correlates with loyalty |
| First Contact Resolution (FCR) | Moderate to High; requires tracking resolution definitions and multiple channels | Moderate to High; agent training and knowledge management | Higher resolution rates, reduced repeat contacts | Complex support environments emphasizing efficiency | Strong correlation with customer loyalty; reduces support costs |
| Average Resolution Time (ART) | Moderate; includes all interaction times with segmentation | Moderate; process tracking and analysis needed | Insight into efficiency, bottlenecks, SLA adherence | Support teams managing diverse issue complexities | Identifies process inefficiencies; aids resource planning |
| Net Promoter Score (NPS) | Low; simple single-question survey | Low; survey setup and trend analysis | Measures customer loyalty and advocacy | Long-term relationship and brand health monitoring | Predicts retention and growth; easy to understand and benchmark |
| Ticket Volume and Trends | Low to Moderate; volume tracking and trend analysis | Moderate; data collection and forecasting tools | Informs staffing, identifies product/service issues | Capacity planning and operational forecasting | Early issue identification; aids proactive resource management |
| Agent Utilization Rate | Moderate; requires detailed time tracking | Moderate; workforce management systems | Optimized staffing and workload balance | Workforce efficiency and productivity optimization | Improves scheduling; supports efficiency without sacrificing quality |
| Customer Effort Score (CES) | Low to Moderate; survey focused on effort perception | Low to Moderate; survey design and analysis | Identifies friction points, predicts loyalty | Process improvement and ease of use evaluation | Strong predictor of loyalty; highlights specific pain points |
Transforming Customer Support with Data-Driven Decisions
From First Response Time (FRT) and Customer Satisfaction Score (CSAT) to Net Promoter Score (NPS) and Customer Effort Score (CES), mastering these customer support KPIs provides a roadmap to exceptional customer service. We've explored eight crucial metrics that, when tracked and analyzed effectively, unlock valuable insights into the health of your customer support ecosystem. By understanding these KPIs, you can pinpoint areas for improvement, optimize agent performance, and ultimately cultivate a customer-centric culture. Remember, the insights gleaned from these customer support KPIs aren't just numbers on a spreadsheet; they represent the voice of your customers, their pain points, and their expectations. Addressing these needs through data-driven decisions translates to increased customer loyalty, positive word-of-mouth referrals, and ultimately, sustainable business growth. Empowering your team with the right tools and knowledge to excel in these areas is an investment in the future success of your organization.
Are you ready to elevate your customer support and transform data into actionable improvements? Voicetta can help you streamline your support processes, automate tasks, and ensure 24/7 availability, directly impacting your key customer support KPIs. Learn more about how Voicetta can empower your team and enhance customer satisfaction by visiting Voicetta today.